TRWD has used EPA’s Water Analysis Simulation Program (WASP) model for over 15 years to evaluate the assimilation capacity of the reservoirs for nutrients. WASP is a fundamentally based, mechanistic model that conserves mass of nutrients from inflow to outflow and grows phytoplankton. This model reconstructs a historical period whereby changes can be made to see if the outcome might be any different. It is a “What if” tool more than a forecaster. Models have been built for one year to 40 years of simulation.
“These models have been great to put all forcing functions into perspective. It is easy to think that one thing may be affecting a reservoir’s water quality, but how can you tease that one thing out without utilizing a model,” asked Mark Ernst, Environmental Manager with TRWD. The latest endeavor is to upgrade to the newest version of WASP, Version 8 and develop a 12-year model for Richland Chambers Reservoir. Version 8 has some features that are really exciting. According to Ernst, “Most notable are the inclusion of solids (sediment from soil erosion) as a state variable and a routine to predict light extinction. Previous versions did not include these features that we have found to be very important characteristics of reservoir function.”
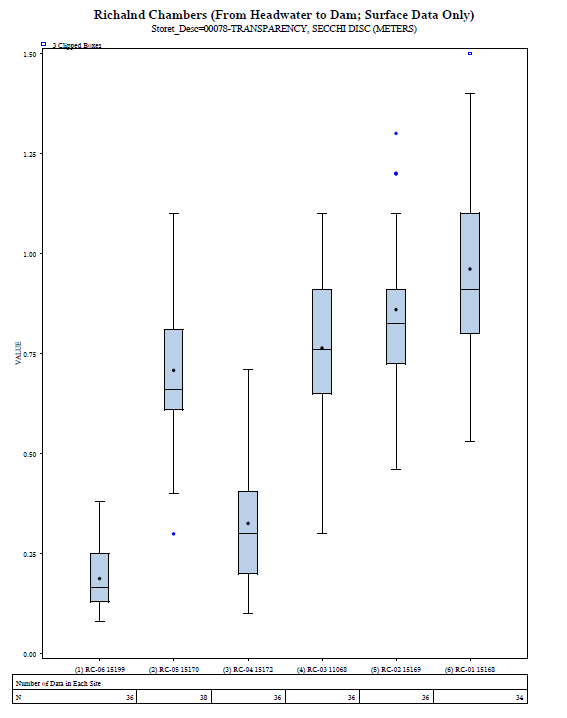
Longitudinal gradients of solids in the water column total suspended solids (TSS) and light penetration are well defined for all TRWD reservoirs. The upper ends of the reservoirs are turbid with little light penetration and the lower, dam areas are clearer with much better light penetration. Interestingly, phosphorus, a key nutrient for algal growth, follows closely with the solids. A reservoir model should reflect these phenomena and do so in a predictive manner such that changes in the watershed will be manifest in the reservoir. “We have seen that light can be very limiting to algal growth in all of our reservoirs, so a model that incorporates predictive light attenuation will be very helpful in predicting the outcome of what-if scenarios” added Ernst.
The model will be developed for the period 2004 through 2015. External loads will be provided by surface water assessment tool (SWAT) modeling done by TX A&M’s Essayas Kaba. Ken Lawrence with IT Nexus will develop the internal flow balance to route monthly inflows through the 10 segments of the reservoir, and include releases, pumping, evaporation and precipitation. Bob Ambrose, who is instrumental in the development of WASP, will assist in the development and calibration of the model. The district expects to have the model complete by the end of 2017.

Pictured to the right: Median and percentiles of Secchi depths from the headwaters (left side of graph) to the dam of Richland Chambers Reservoir illustrates the typical longitudinal gradient of water clarity. This increase in clarity is inverse to the TSS and total Phosphorus concentrations.


