The latest lake level projections are shown below. You will also find:
- Links to historical lake level plots
- Last month’s projections compared to what actually happened
The combination of high temperatures, higher demands, and lack of rain in August contributed to the decline of TRWD’s total system storage from 95% to 90%, which is typical during hot and dry summers. Currently, the levels of all TRWD lakes are falling and are expected to continue falling if conditions stay dry. TRWD’s Meteorologist, Courtney Jalbert, provides information on what we can expect in terms of rainfall and temperatures going into the next couple of months and their impacts to lake levels in the “From our Meteorologist” section.
Thank you for following the Lake Level Blog and check back next month for more projections.
From our Meteorologist
August Summary…
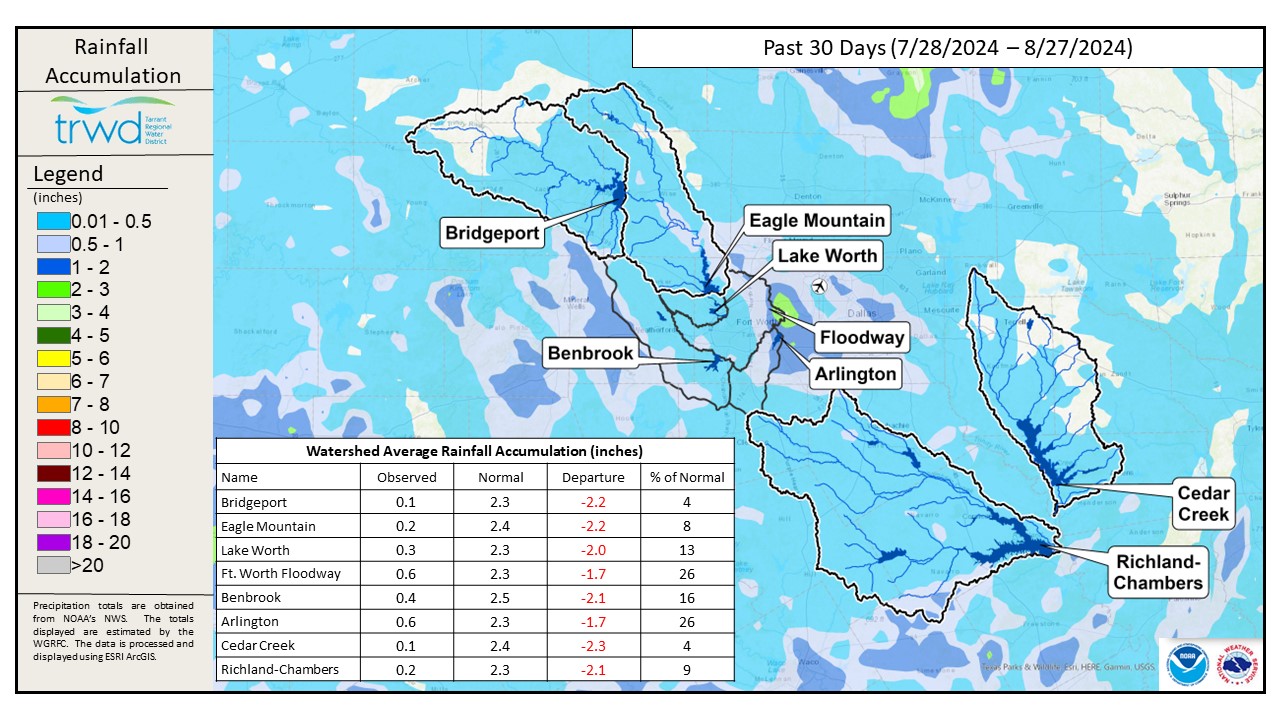
August brought on the heat with temperatures around 3.3 degrees above normal. Although temps were above normal, North Texas only registered 15 days above the century mark in August so far, topping out around 107 on August 19th. Rainfall was very sparse throughout the region as seen in the month to date precipitation map below. DFW recorded only 0.35” of rainfall, 1.39” below normal. TRWD’s reservoirs did not receive as much precipitation with rainfall totals less than 0.2 in both the western and eastern reservoirs. A change is in store the last week of August as a chance of scattered showers and thunderstorms returns and high temperatures stay generally in the mid to upper 90s. Even cooler weather arrives with a cold front Labor Day weekend that will keep precipitation and cloudy skies in the forecast.
30-Day Rainfall Totals
Drought intensity increased for parts of North Texas over the last month as the hot and dry weather intensified, soil moisture decreased, and fire impact responses increased. D1, Moderate Drought, and D0, Abnormally Dry now dominate about 50% of the North Texas Area as seen on the local drought intensity map. TRWD’s West Fork is in the D1 and D2 category, while the East Texas reservoirs are in the D0 drought intensity level.
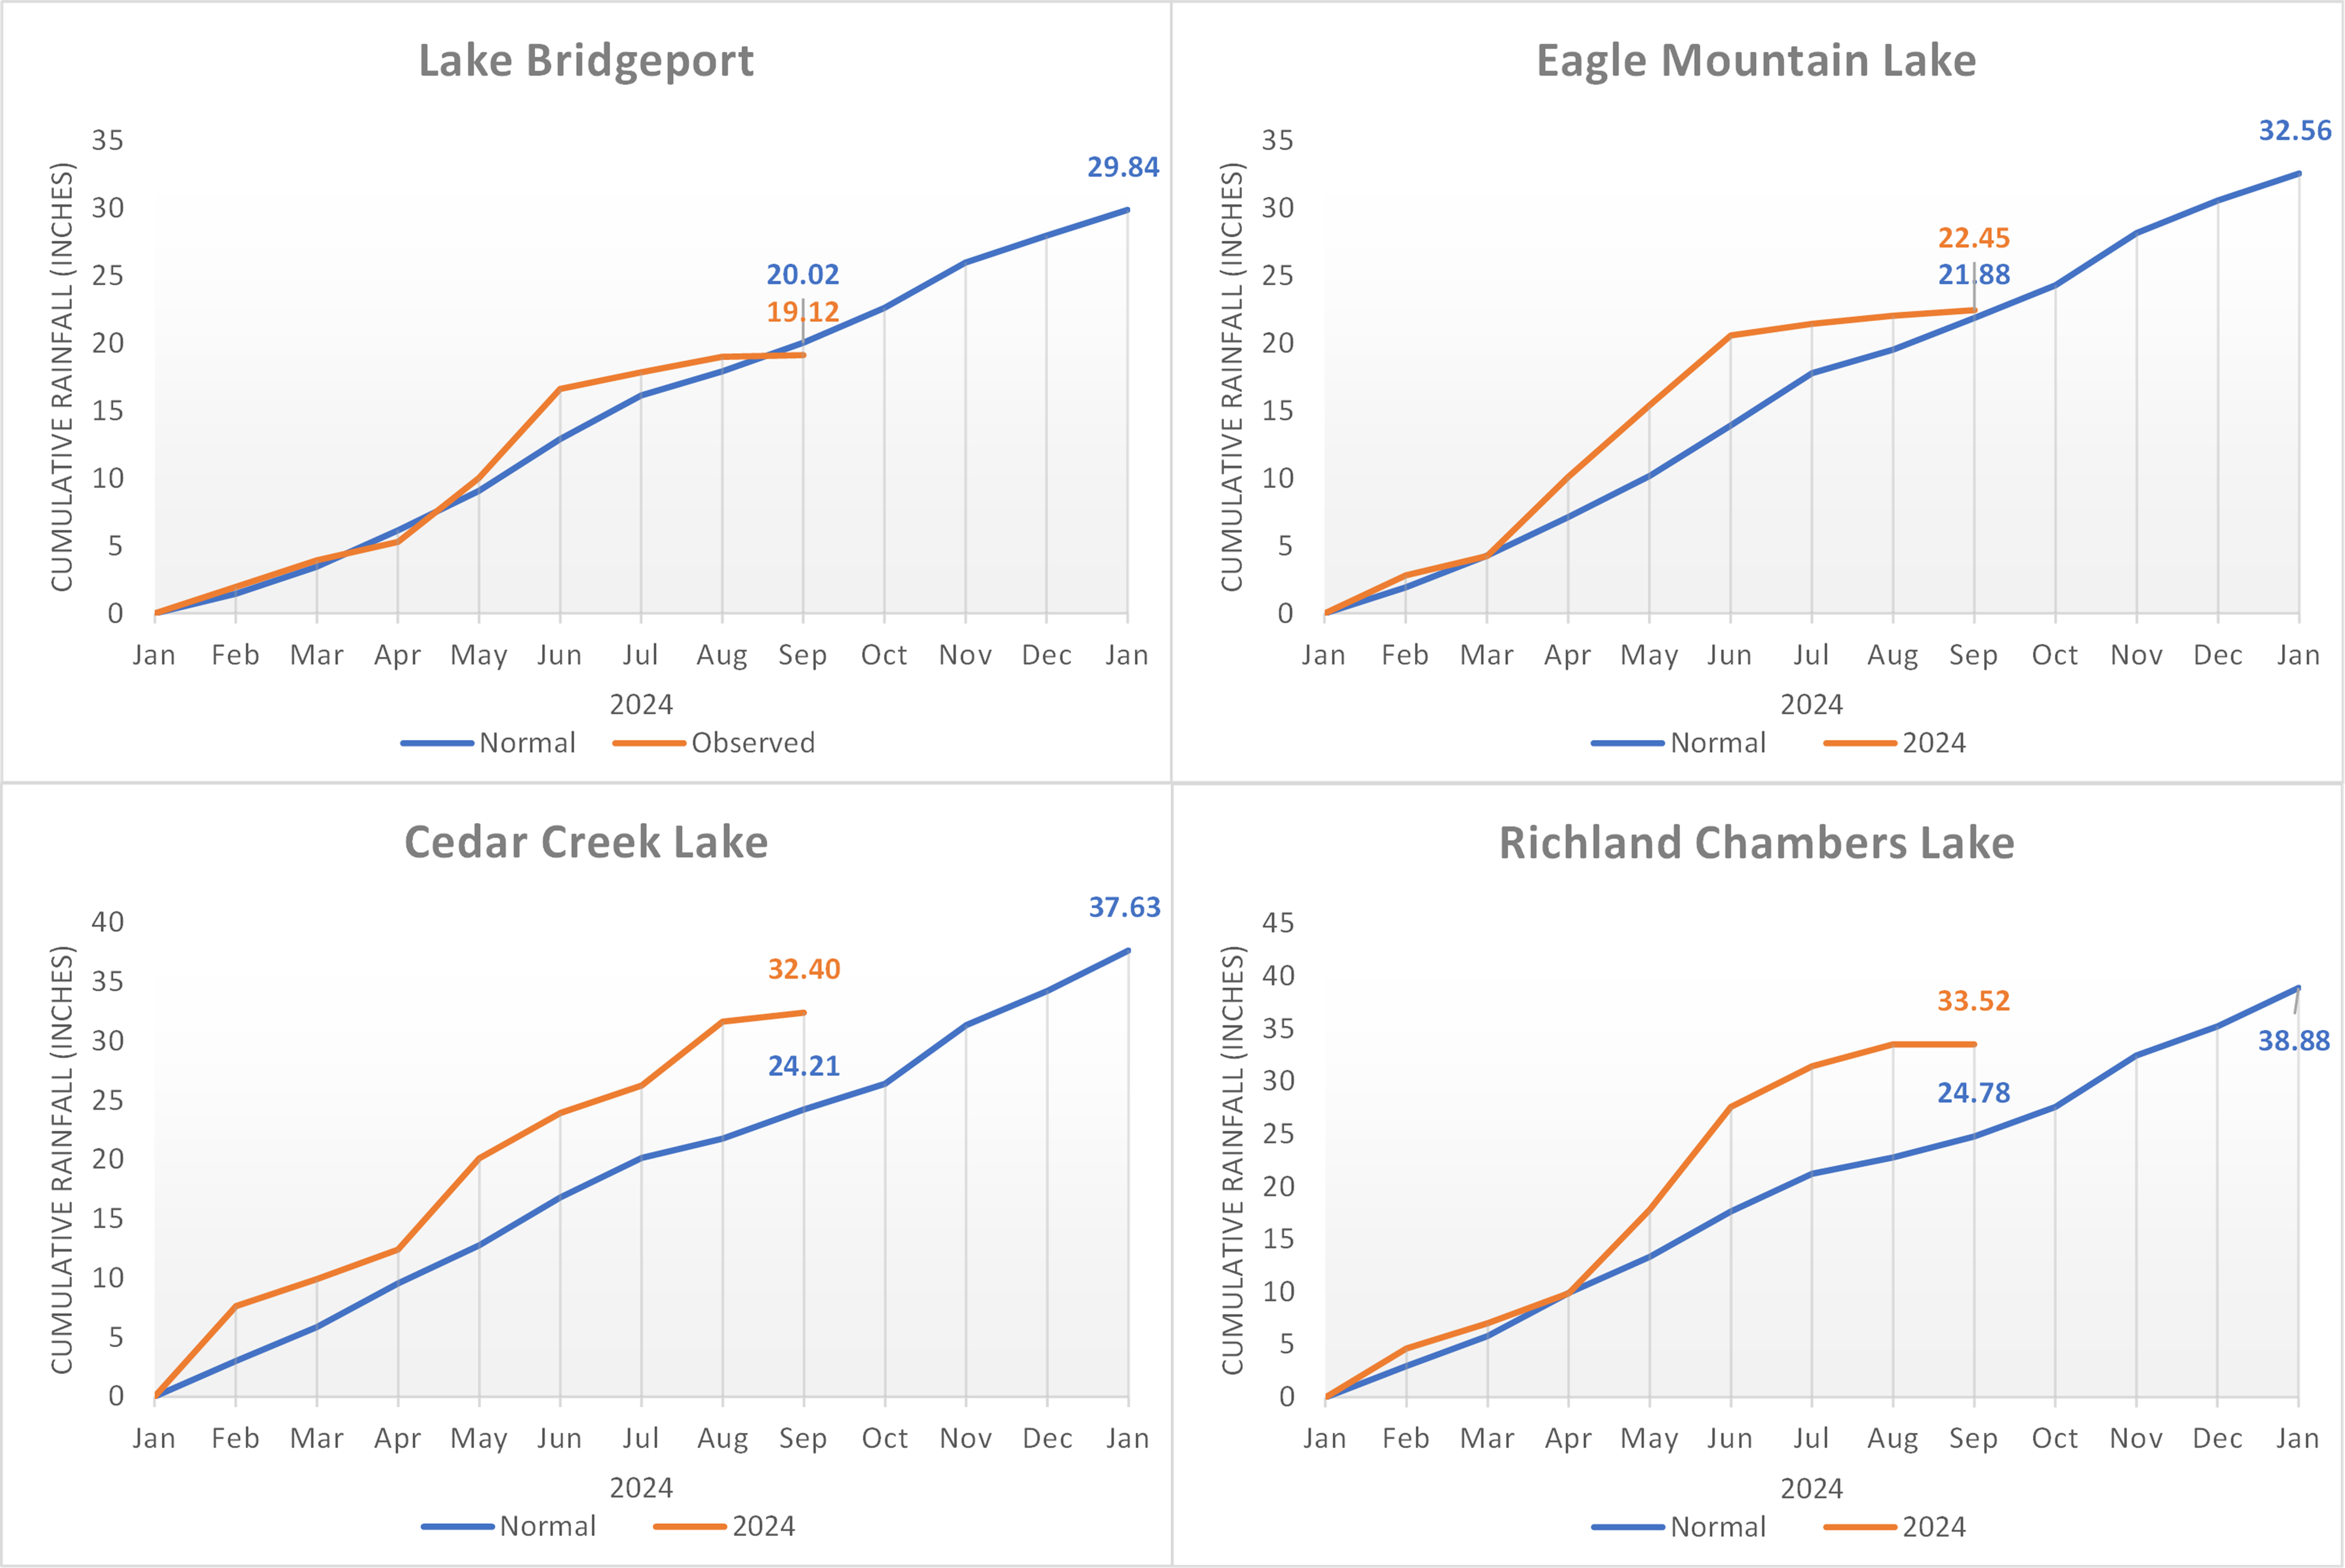
TRWD Lake Rainfall Totals though August 27, 2024
Looking ahead…
The intense summer heat may be behind us as the models are indicating temperatures below normal and close to normal in the 6-10 day and 8-14 day outlooks as the upper-level pattern remains active and the high-pressure dome disappears for a bit. With that pattern change, rainfall will also have a higher likelihood in North Texas as indicated in the Climate Prediction Center 6-10 day and near normal in the 8-14 day precipitation outlooks.
Unfortunately, a hot and dry early fall season is expected in North Texas from the climate models for the September-October-November Temperature Outlook and the September-October-November Precipitation Outlook. The below normal precipitation and above normal temperatures across the Central to Southern Great Plains is based on several models.
In the Pacific ENSO-neutral conditions are present, and a La Nina watch has been issued with models favoring development early fall. If development comes to fruition, a La Nina winter generally brings a drier and warmer weather pattern over North Texas.
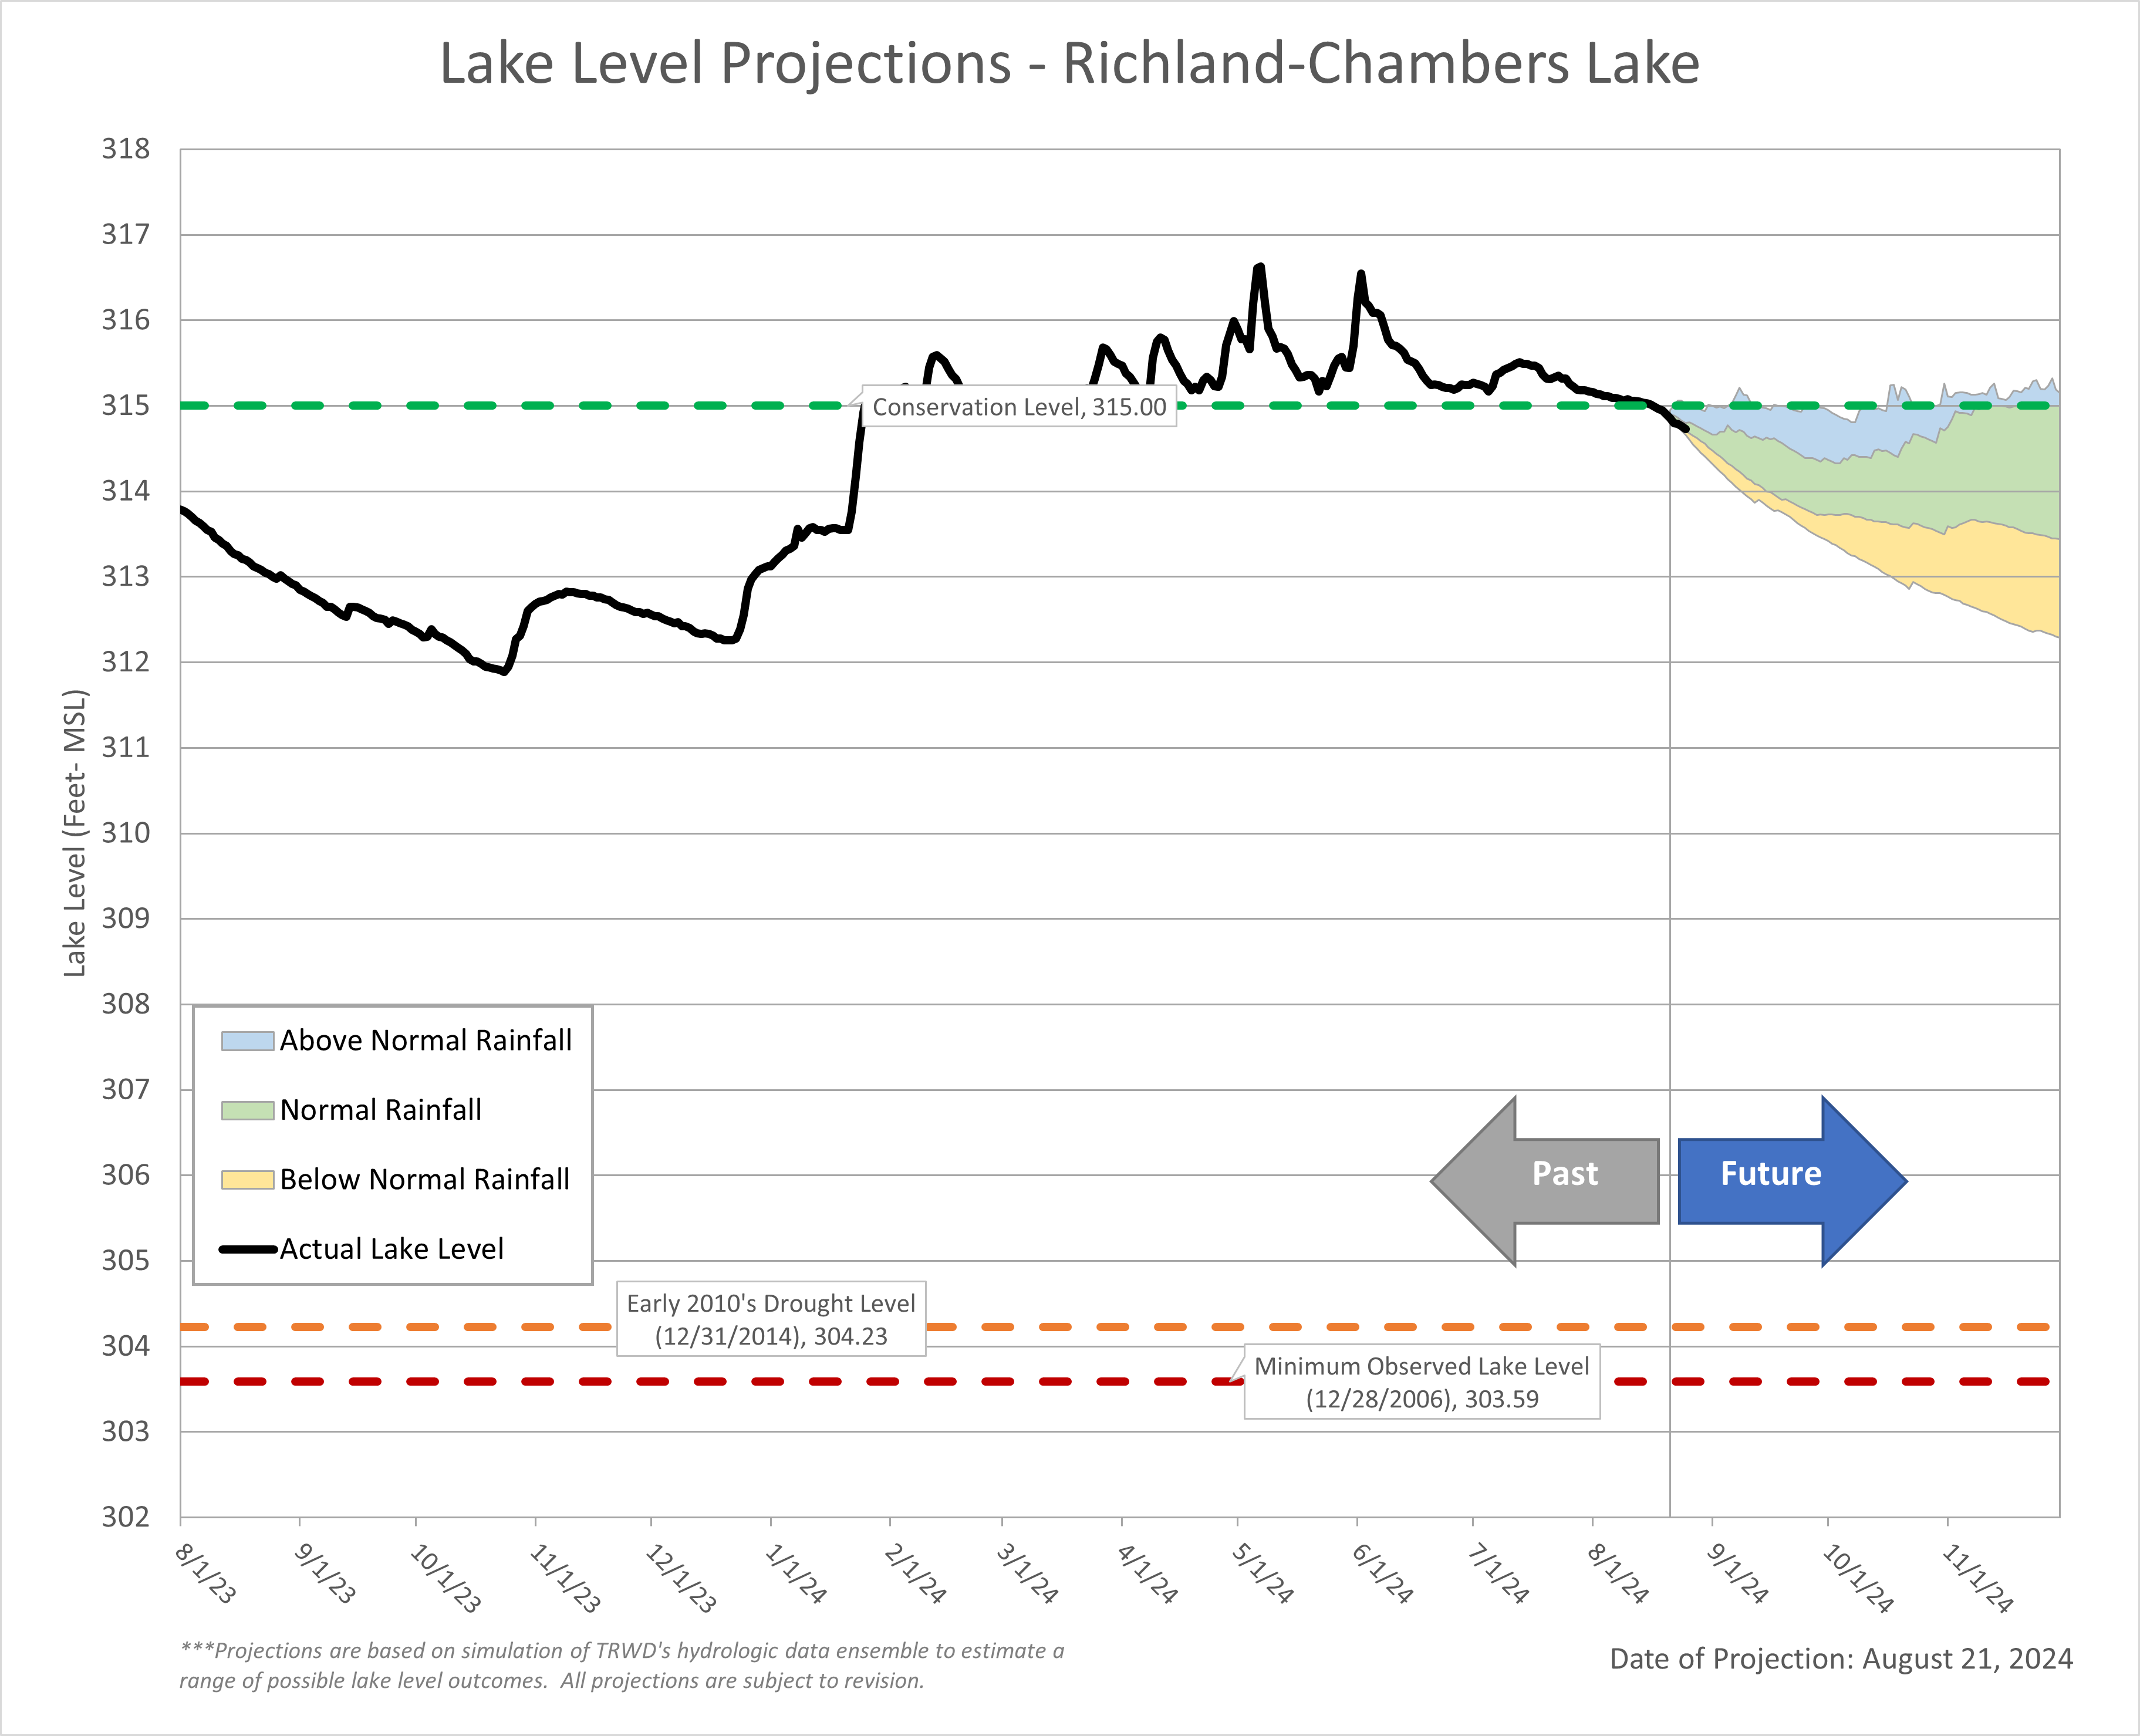
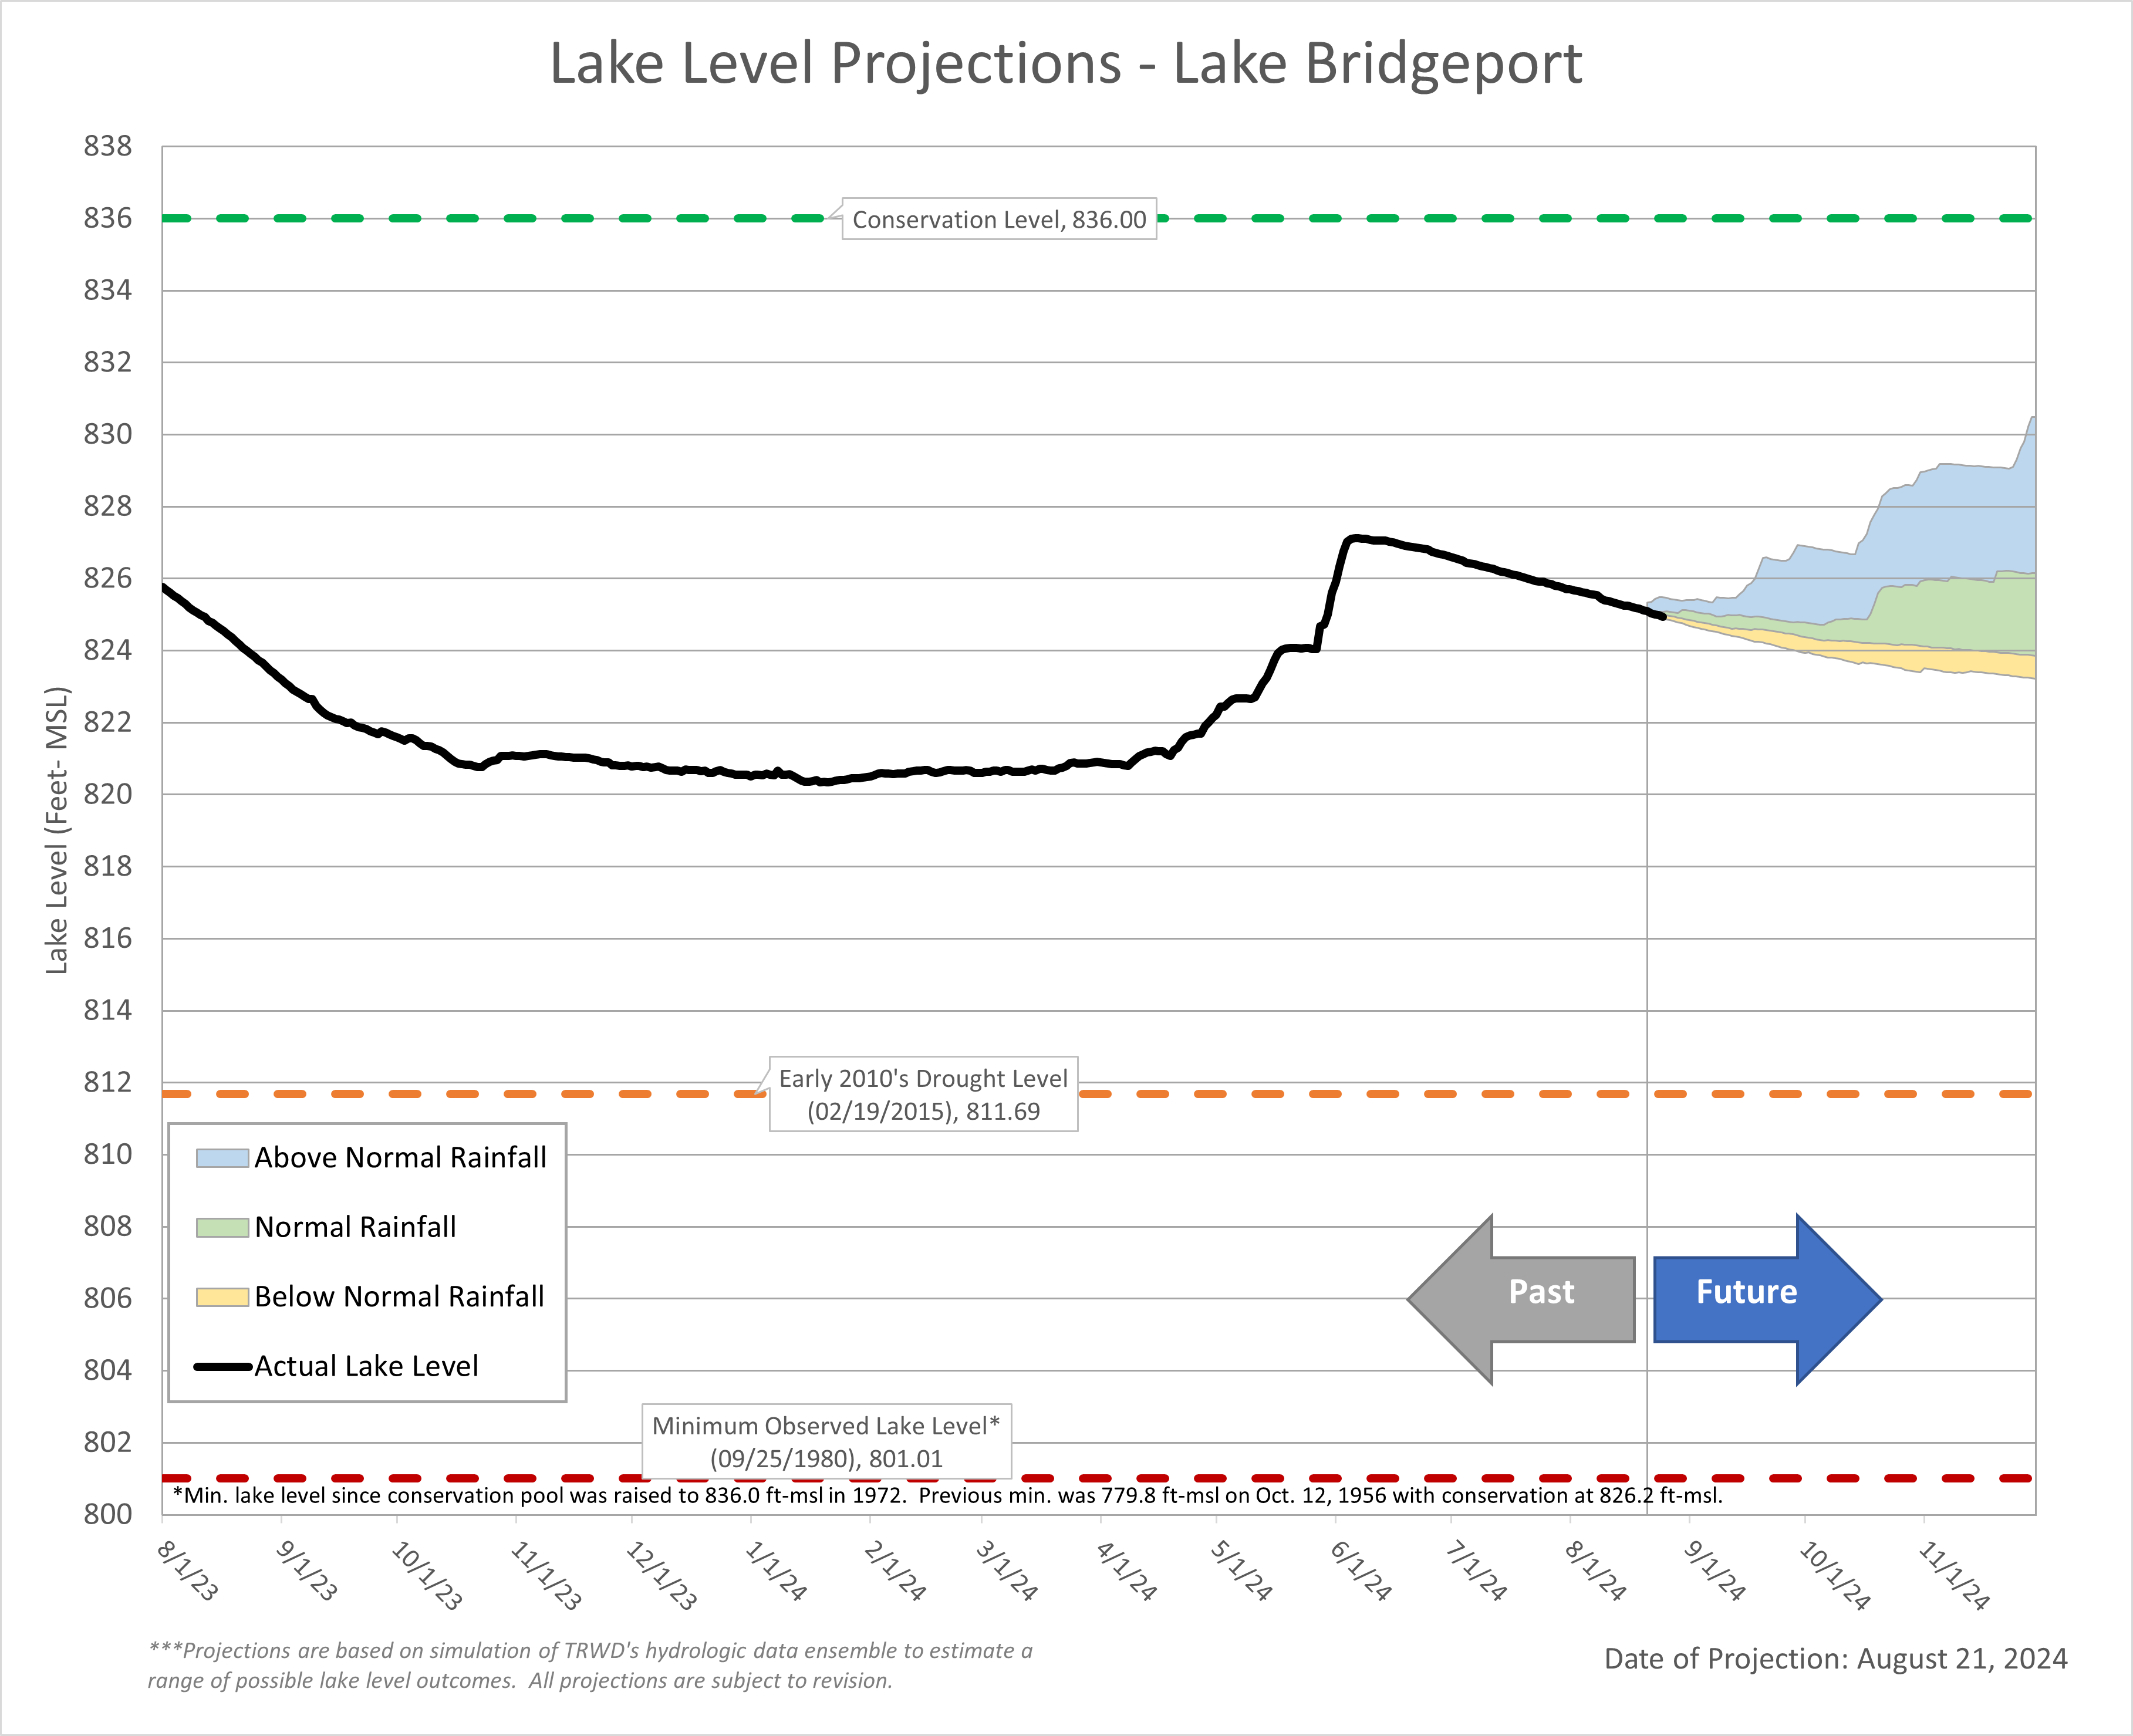
Projections
Lake Bridgeport
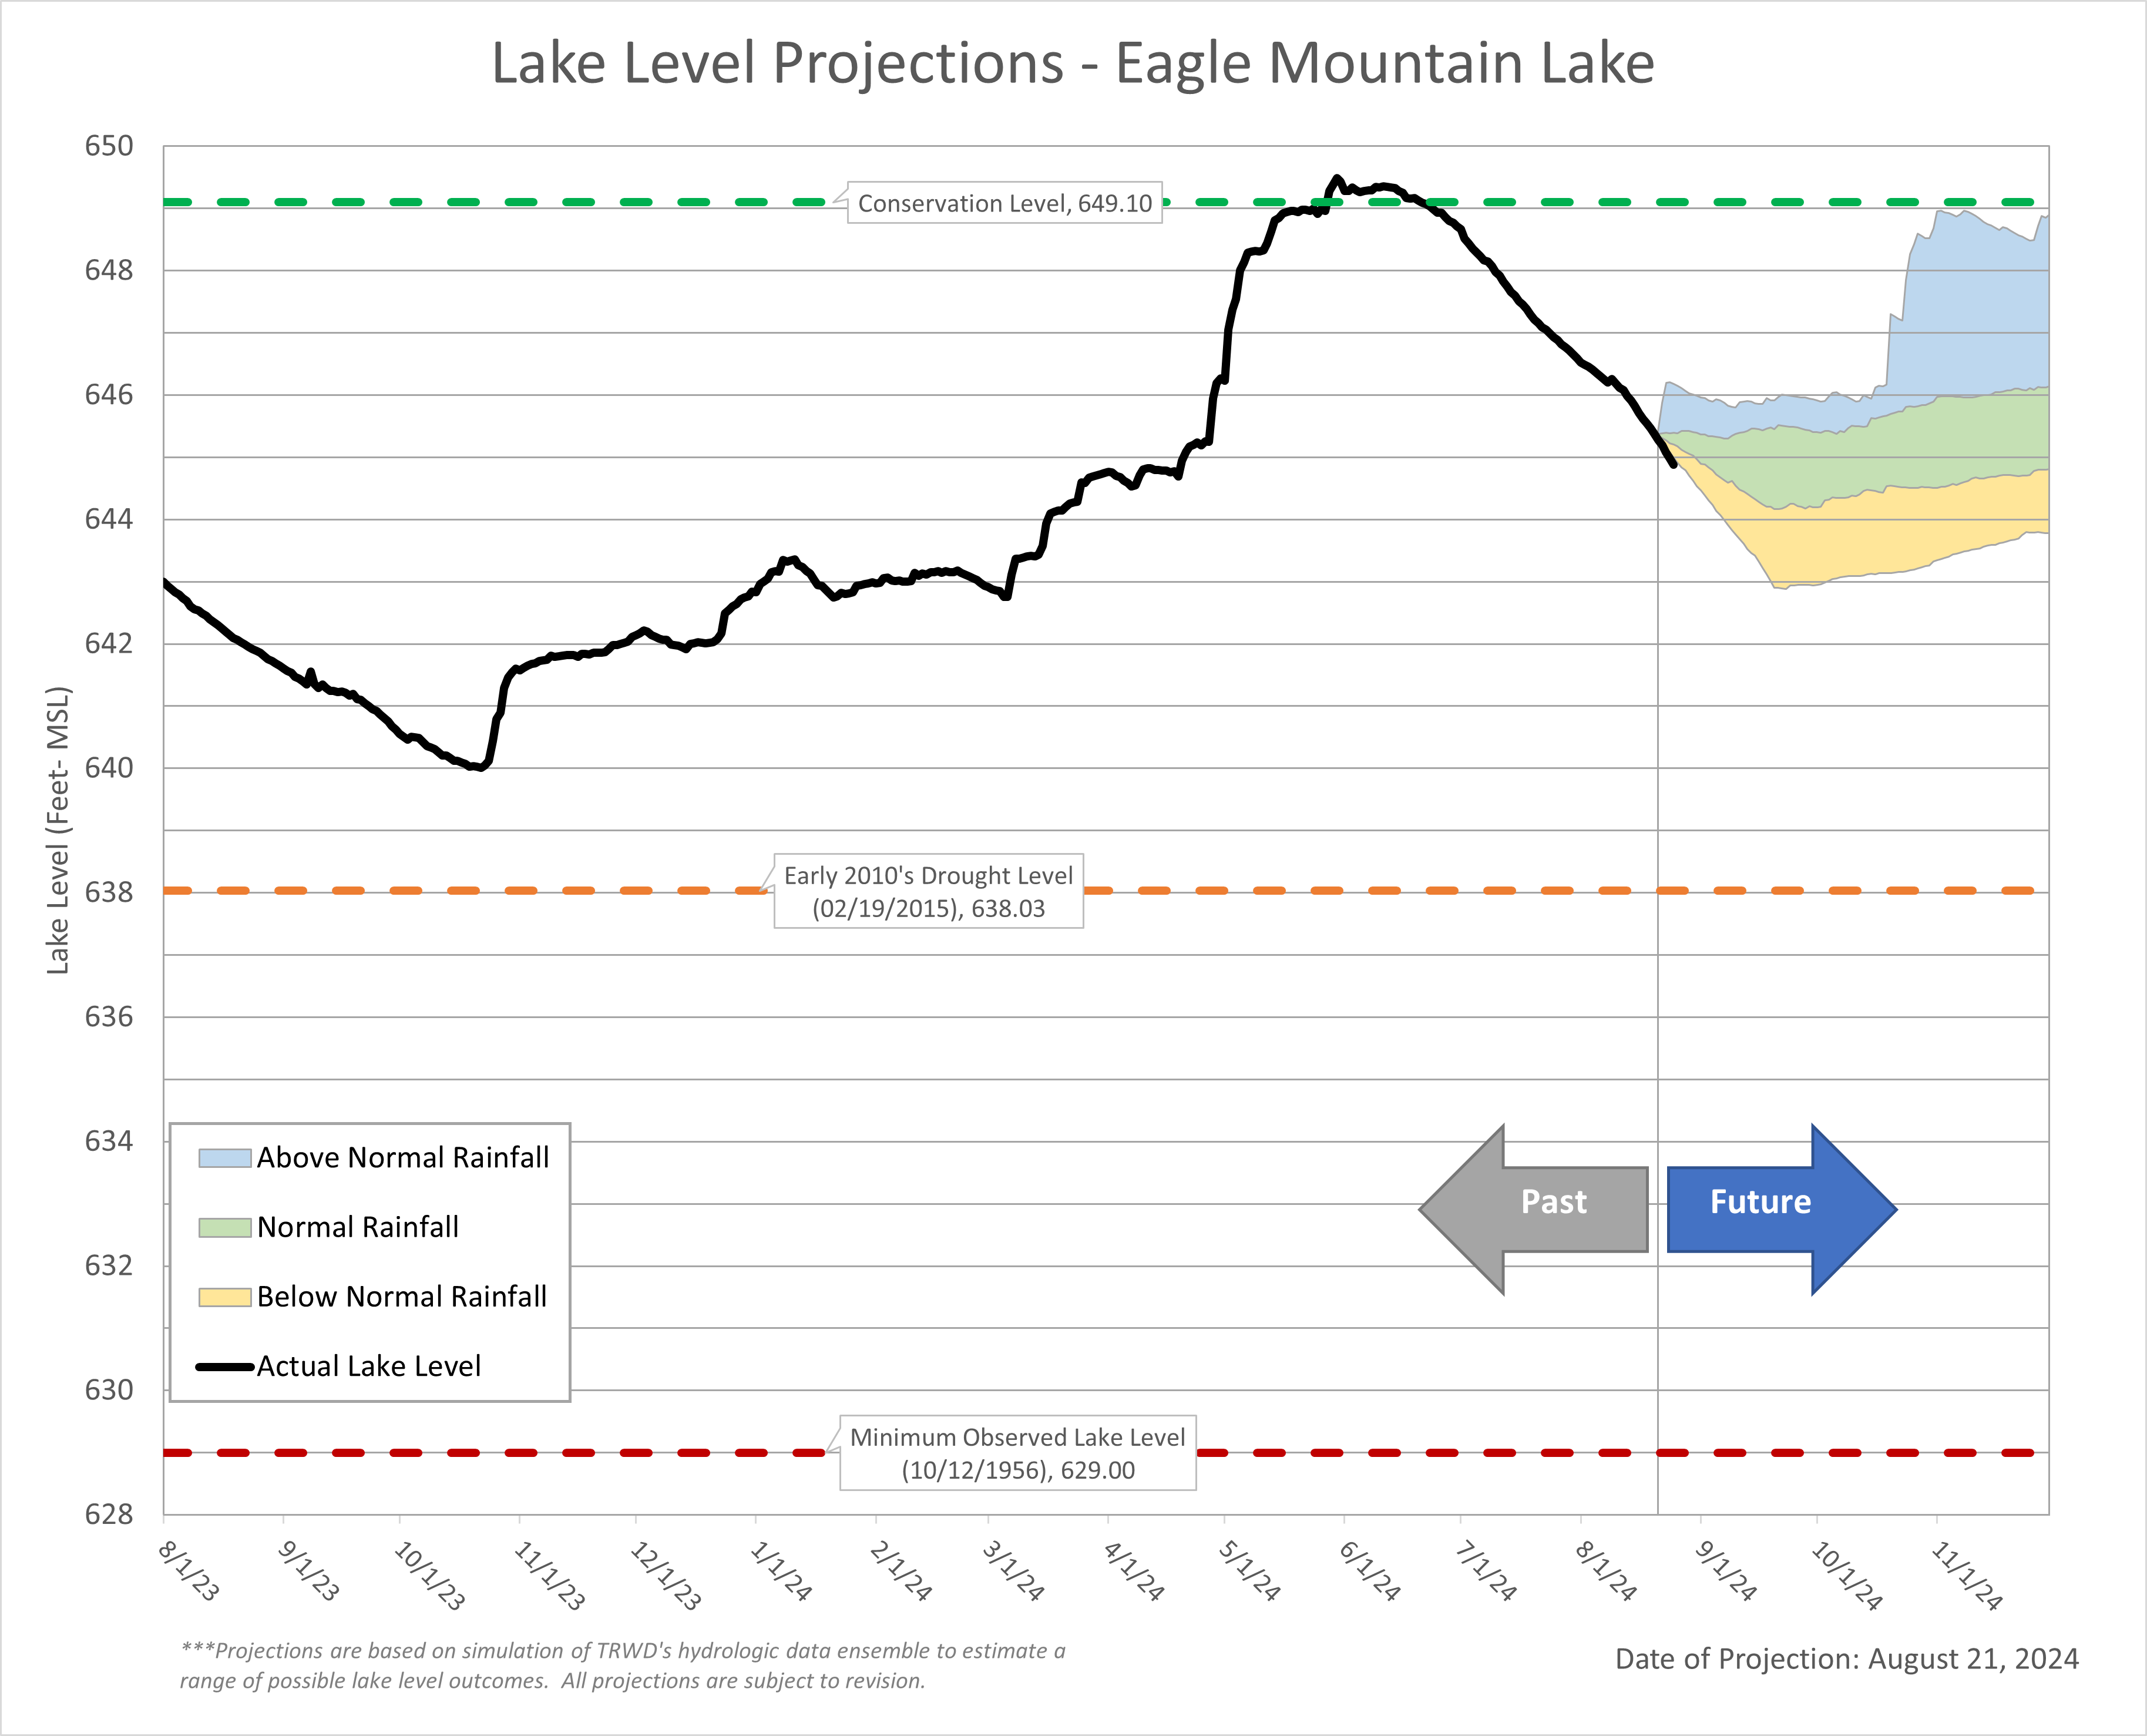
Eagle Mountain Lake
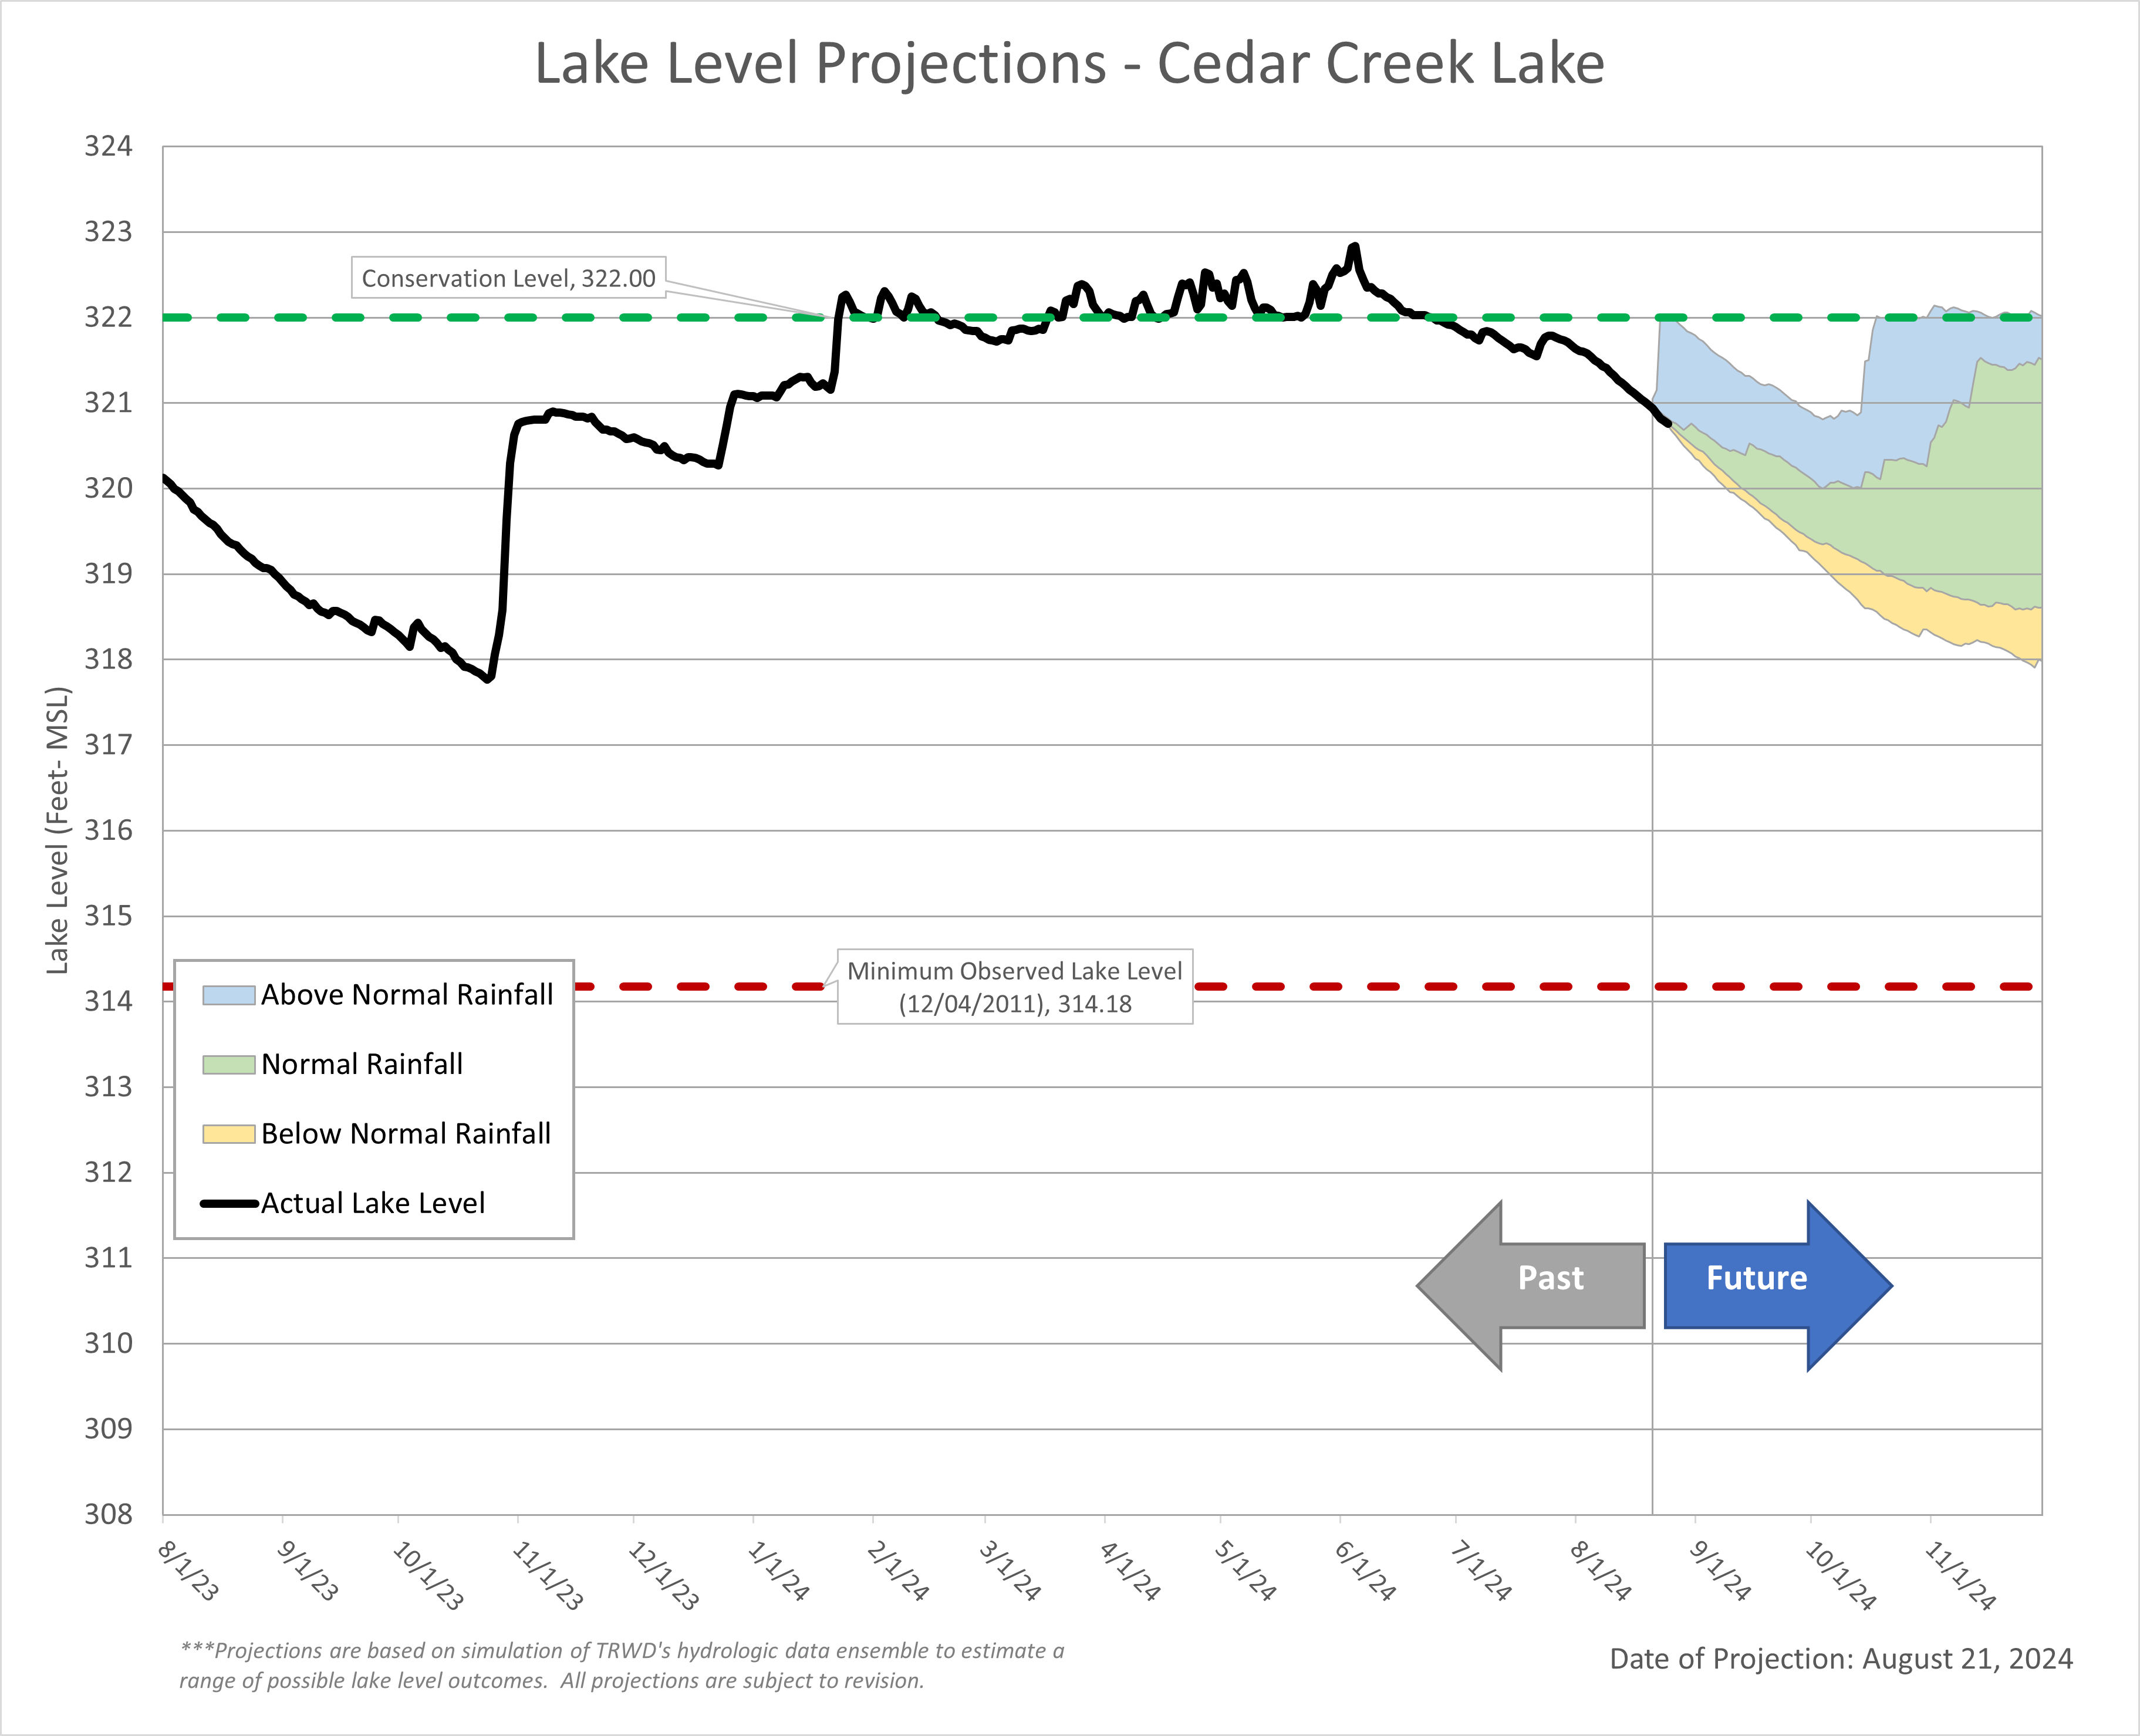
Cedar Creek Lake
Richland-Chambers Lake