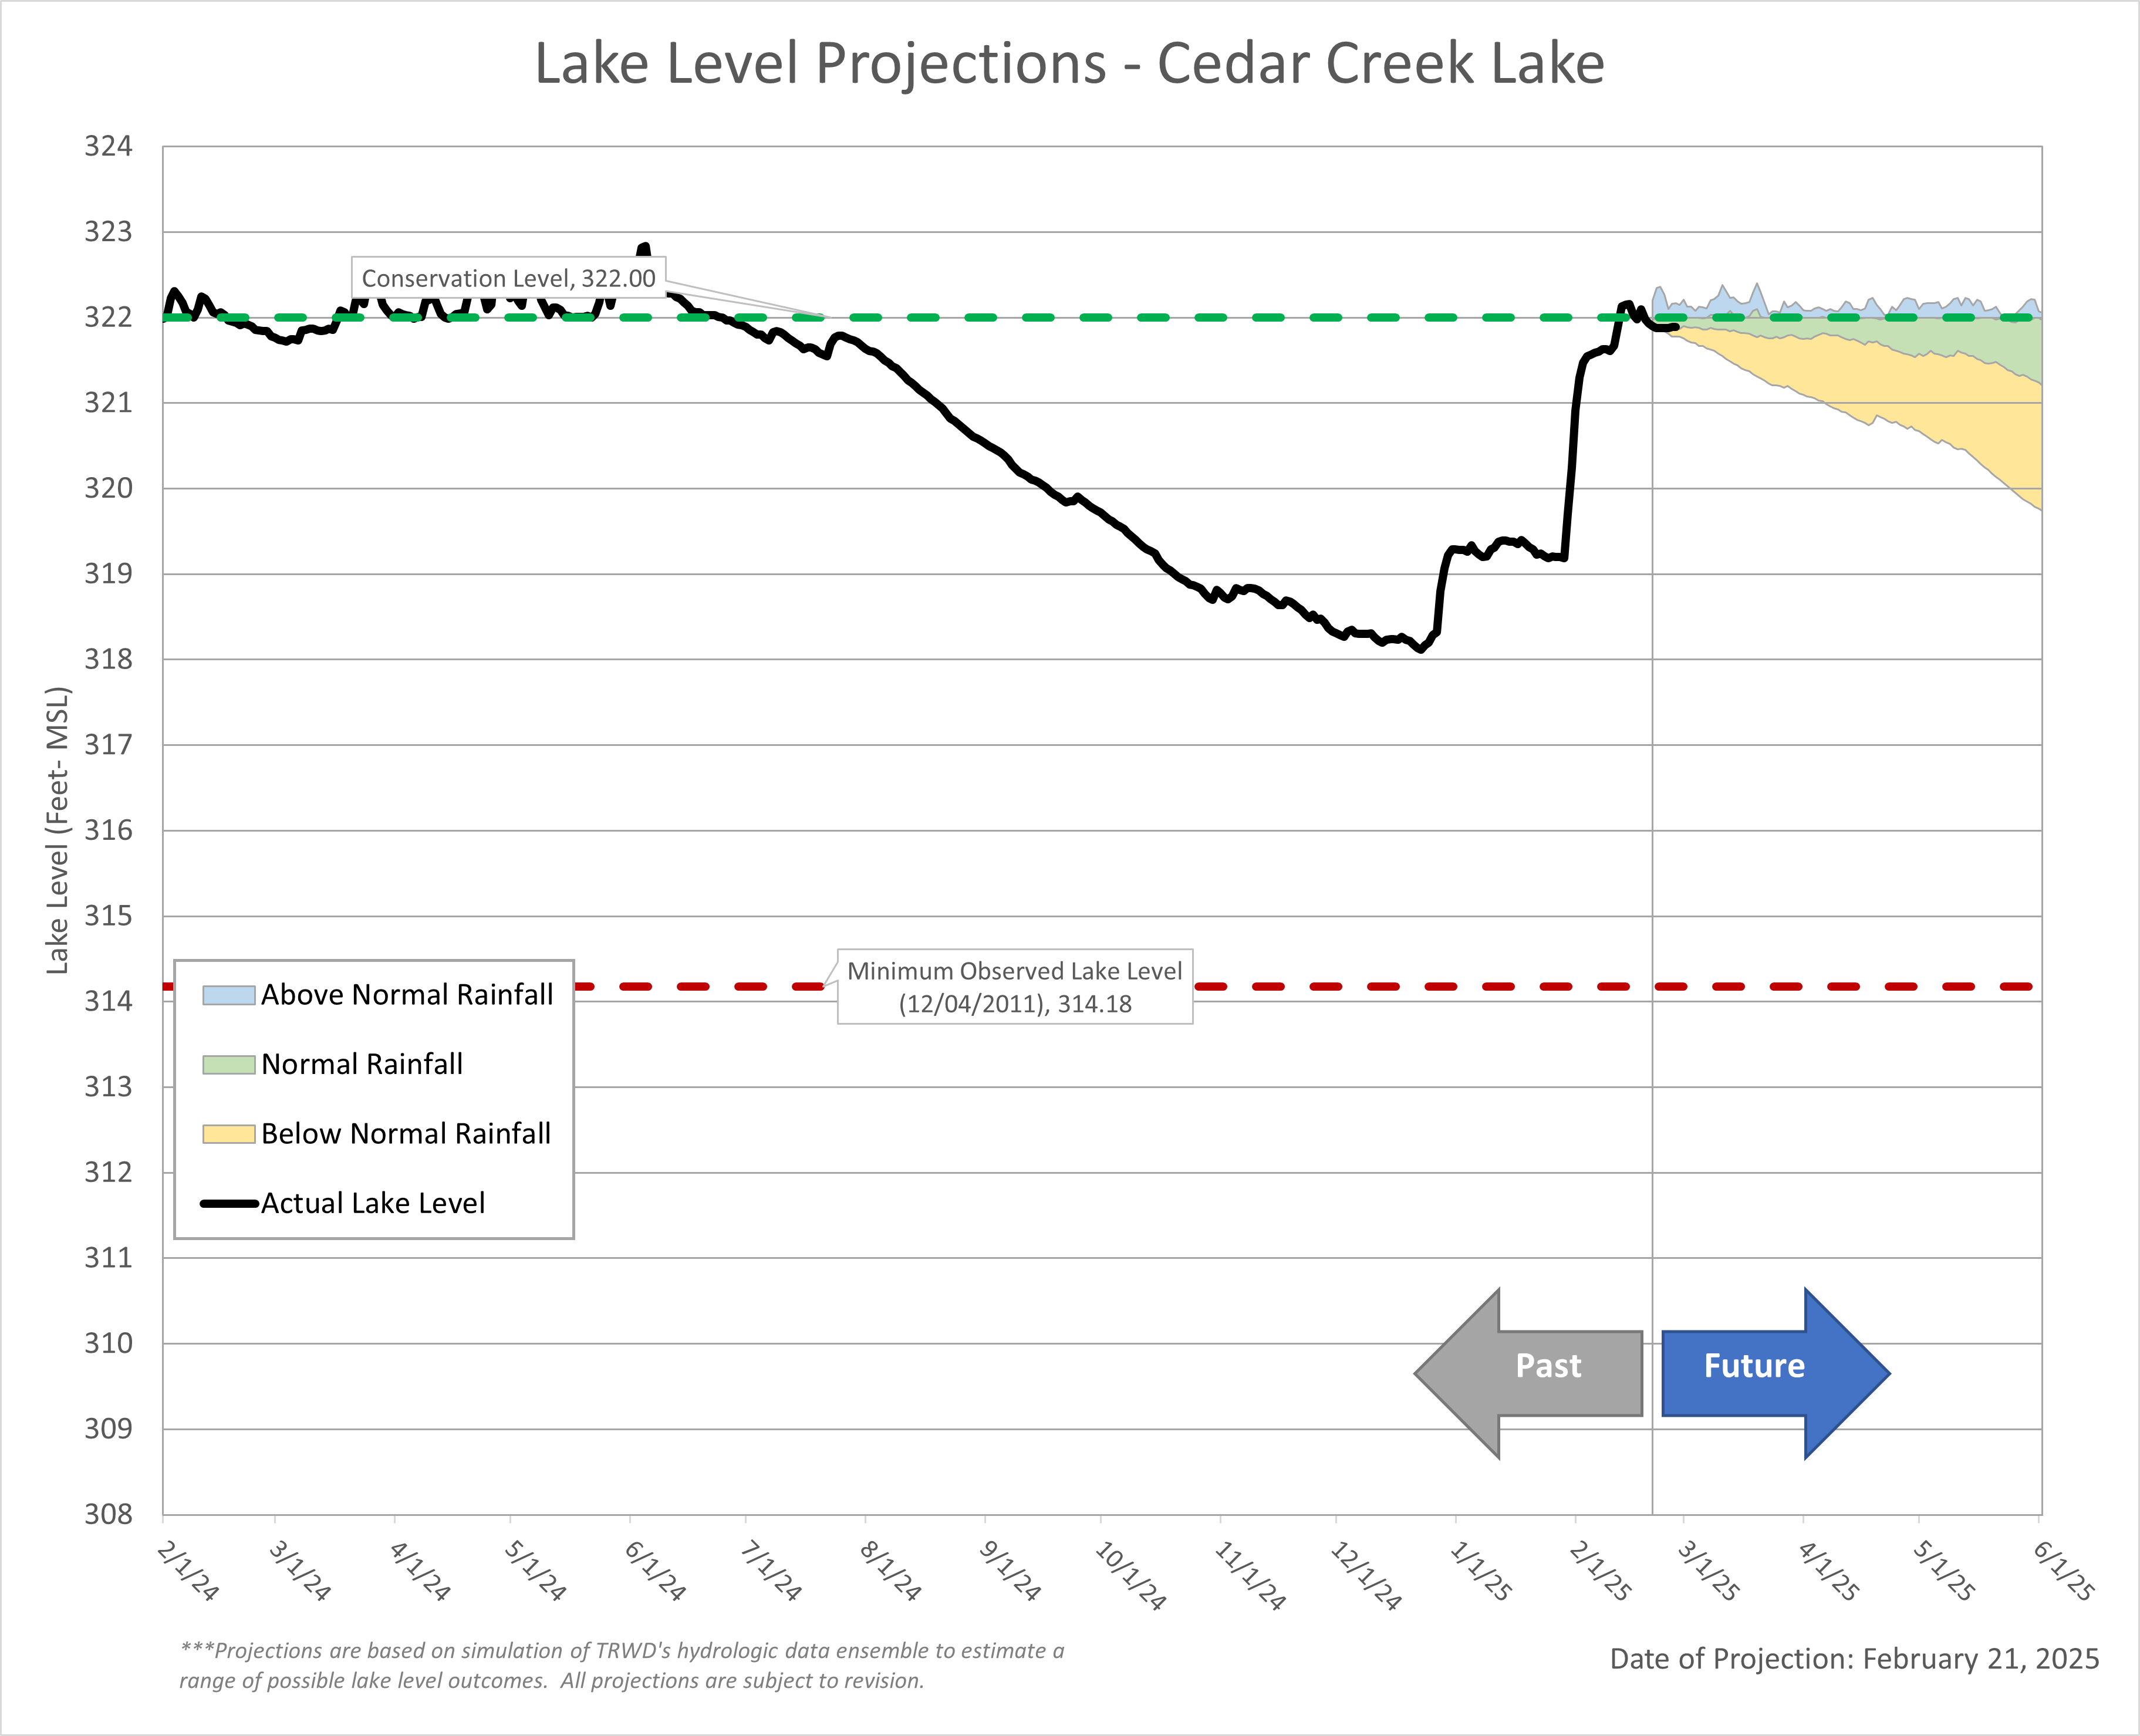
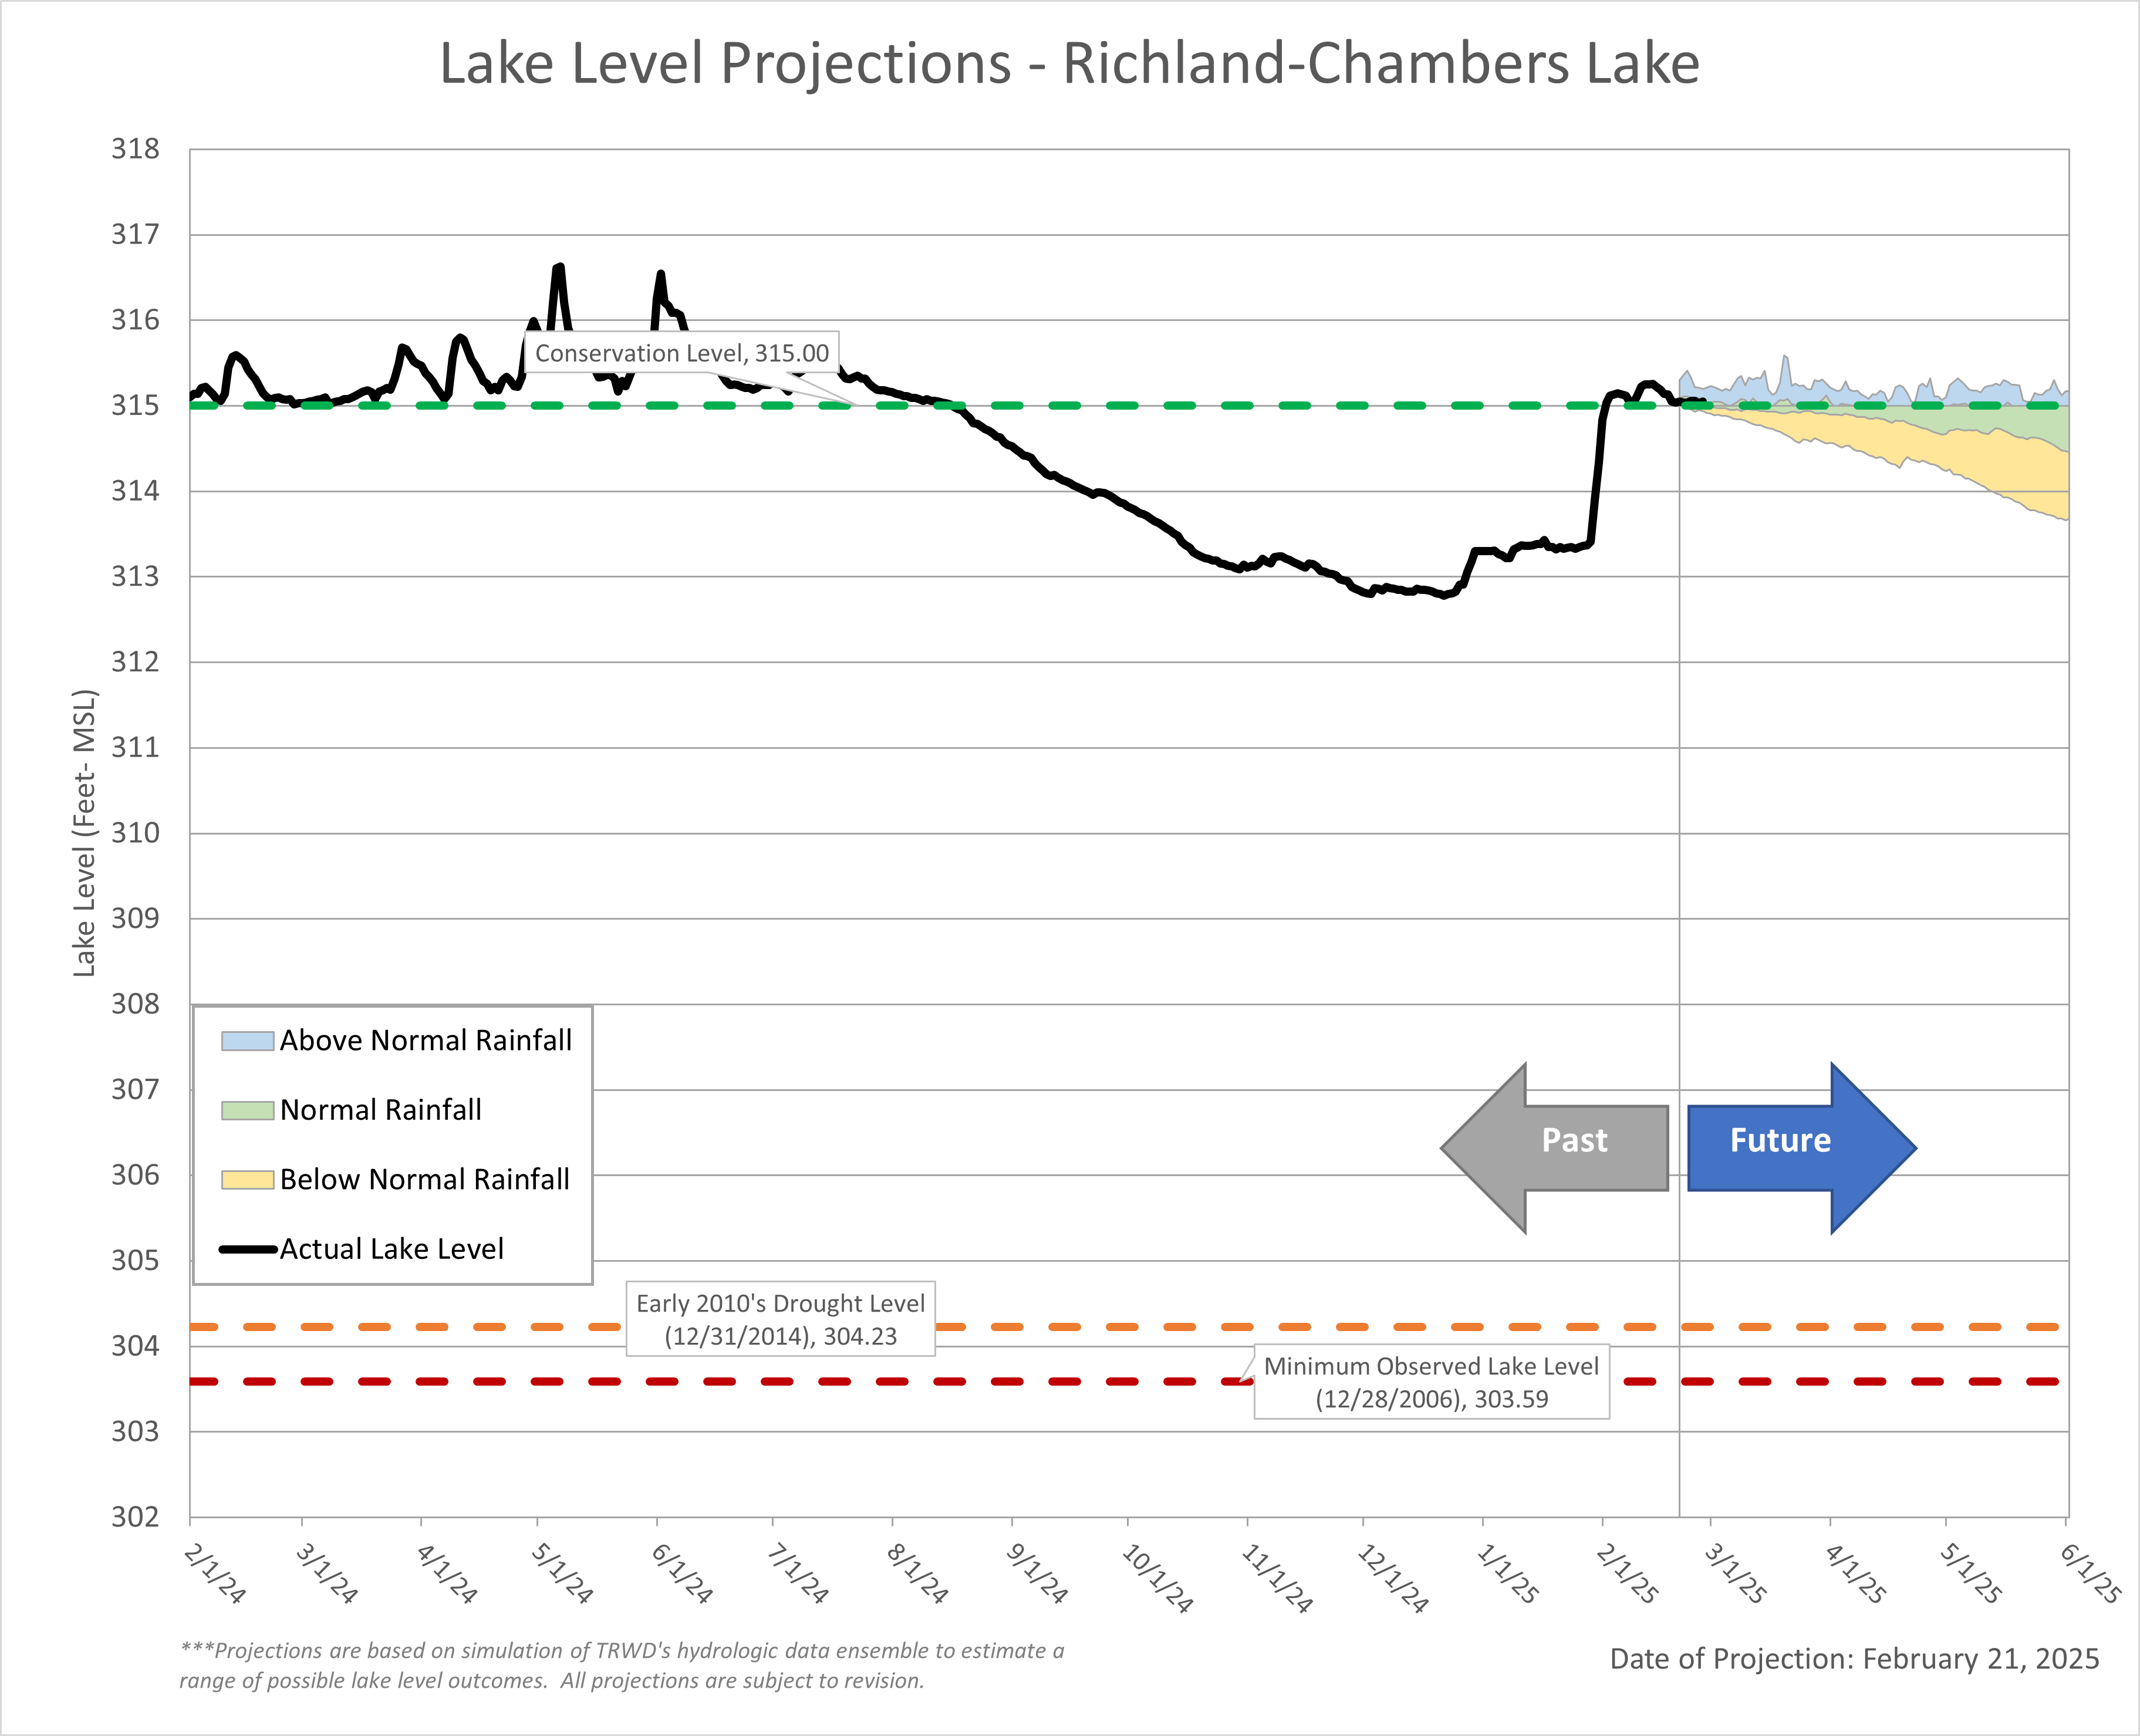
February was a weather roller coaster! We started with temperatures way above normal and ended with temperatures well below normal. The rains were a blessing for our East Texas lakes (Cedar Creek and Richland-Chambers), which are now full or nearly full. Thanks to the rain, our system storage improved by about 7% in the last 30 days, bringing it to 94%.
Highlights:
- Temperature Swings: February started warm, with a high of 88°F on the 8th, almost 20 degrees above normal. By the third week, winter returned with temperatures dropping into the low teens and wind chills below zero. Despite some warmer weather, overall temperatures were around 2°F below normal for the month.
- Rainfall: Rainfall in the region varied greatly. DFW received 1.34” of rain, which is 1.18” below normal. The West Fork saw even less, with Bridgeport and Eagle Mountain getting only 0.5” and 1.10” respectively. East Texas reservoirs did slightly better but were still below normal, with Cedar Creek and Richland Chambers receiving 5.4” and 4.4”.
- Drought Conditions: The lack of rainfall in the West Fork has led to drought conditions creeping back into the region. The West Fork is now in the abnormally dry category, but East Texas remains drought-free for now.
Looking Ahead:
- March Forecast: Expect a warmer start to March with light precipitation in North Texas. Overall, above-normal temperatures and the below-normal rainfall are expected.
- Spring Outlook: The current ENSO (El Niño-Southern Oscillation) outlook indicates that La Niña conditions are present meaning below-normal precipitation and above-normal temperatures across the Central to Southern Great Plains. However, a transition to ENSO-neutral conditions is expected this spring. This means that the influence of La Niña will start to diminish leading to more typical weather patterns.
Stay Informed:
- Check out the latest lake level projections below.
- Links to historical lake level plots.
- Last month’s projections compared to actual outcomes.
Thank you for following the Lake Level Blog. Check back next month for more updates!
TRWD Watershed Rainfall
30-Day Rainfall Totals
TRWD Lake Rainfall Totals through February 27, 2025
Lake Level Projection
Lake Bridgeport
Eagle Mountain Lake
Cedar Creek Lake
Richland-Chambers Lake
Acknowledgments:
- Weather Insights: Special thanks to Courtney Jalbert, TRWD’s Meteorologist, for providing detailed weather insights and forecasts.
- Reservoir Projections: A big thank you to Vini deOliveira for his timely reservoir projections.
- Rainfall Analysis: Appreciation goes to Ashley Lowrie for her thorough analysis of observed rainfall.