The latest lake level projections are shown below. You will also find:
- Links to historical lake level plots
- Last month’s projections compared to what actually happened
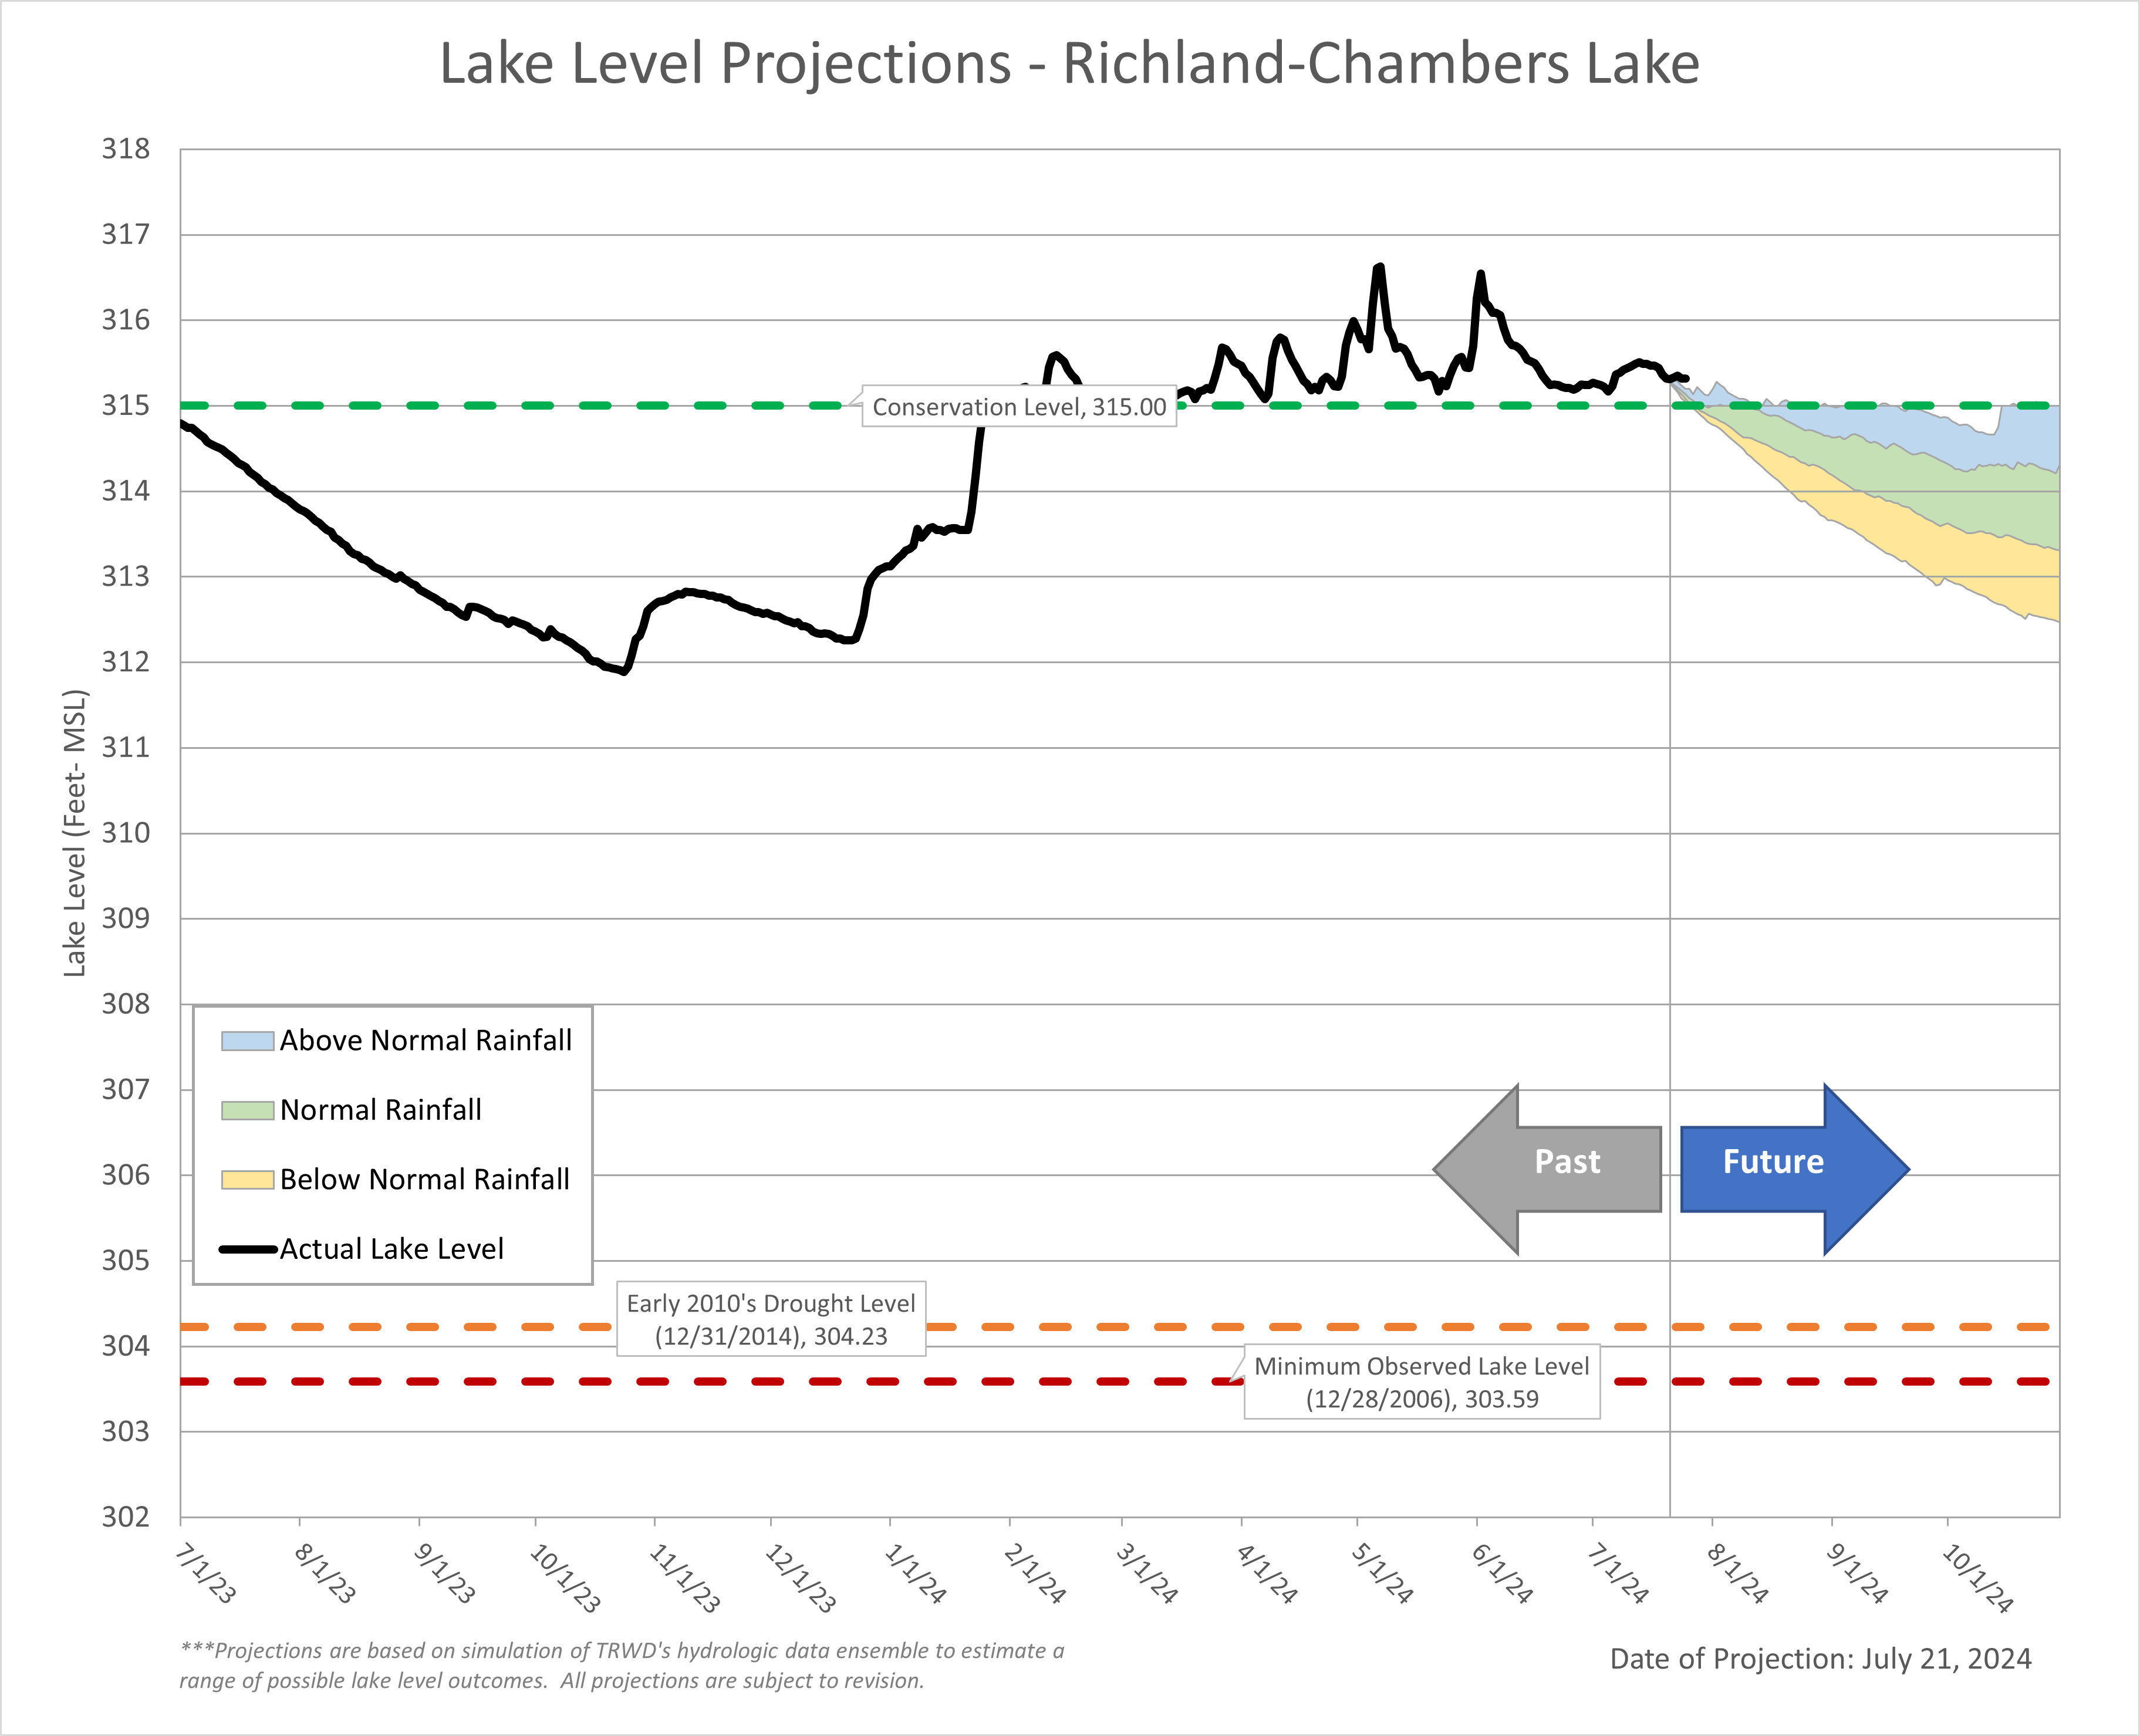
A mild summer so far has helped maintain the TRWD total system storage at 95%. That is only a decrease of around 2% in total storage in the past 30 days. This is due to the East Texas system storage, which remains near full after a wet spring. Richland-Chambers remains above conservation level due to a steady inflow of water from the upstream flood protection reservoirs (Bardwell and Navarro-Mills) owned by the United States Army Corps of Engineers (USACE). The purpose of these lakes is to store floodwater and release it when downstream channel conditions permit. At their peak in June, both lakes stored nearly 18 feet of flood water. This is equivalent to 5 feet of water at Richland-Chambers! West Fork (Bridgeport and Eagle Mountain) system storage has decreased by 4.8% due to lack of rainfall, increased water usage, and evaporation from higher temperatures. TRWD’s Meteorologist, Courtney Jalbert, provides information on what we can expect in terms of rainfall and temperatures going into the next couple of months and their impacts to lake levels in the “From our Meteorologist” section.
Thank you for following the Lake Level Blog and check back next month for more projections.
From our Meteorologist
July Summary…
The first half of July turned the heat up with temperatures averaging over 2 degrees above normal. Around the 16th of July the weather pattern changed, and several disturbances have brought in cloud cover and rain. As a result, temperatures dropped to more than 4 degrees cooler than normal! As of July 23rd, DFW recorded 2.53” of rainfall, 0.87” above normal. However, TRWD’s western reservoirs saw rainfall totals less than an inch at Eagle Mountain and just over an inch at Bridgeport. This can be seen in the 30-Day Rainfall Totals below. Rainfall chances will start to lessen for North Texas and temperatures are expected to rise and be close to the century mark as we close out July.
30-Day Rainfall Totals
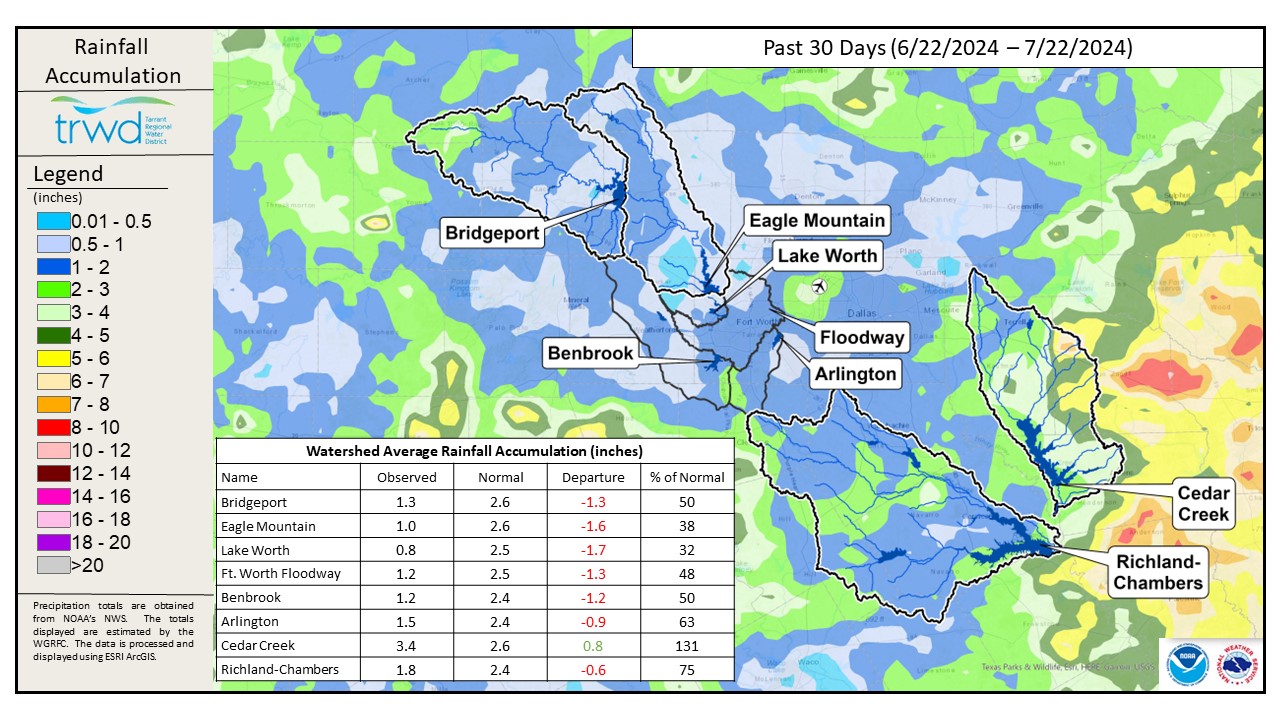
Due to the lack of rainfall in some parts of North Texas, Abnormally Dry (D0) intensity has begun to creep into the region. The West Fork of the TRWD system in particular saw a much bigger deficit in June and July so far. East Texas remains clear of any drought intensity.
TRWD Lake Rainfall Totals though July 22, 2024
Looking ahead…
Summer has decided to give Texas a bit of a reprieve in July, but the models are indicating that temperatures will be back to slightly above normal in the 6-10 day and 8-14 day outlooks as high pressure builds aloft. Rainfall will have a lower likelihood in North Texas as indicated in the Climate Prediction Center 6-10 Day and 8-14 Day precipitation outlooks with the high pressure blocking rainfall from making it into the region leading to a more typical July/August pattern.
In the extended August-September-October Precipitation Outlook, North Texas sits between an expected above normal probability of precipitation to the east and below normal probability of precipitation to the west. The enhanced probability of higher than normal precipitation along the Gulf Coast and parts of East Texas is attributed to a forecasted above normal hurricane season. Unfortunately a hot summer is expected to return in the climate models for the August-September-October Temperature Outlook.
In the Pacific, ENSO-neutral conditions are present and a La Nina watch has been issued with models favoring development early fall. If development comes to fruition, a La Nina winter generally brings a drier and warmer weather pattern over North Texas.
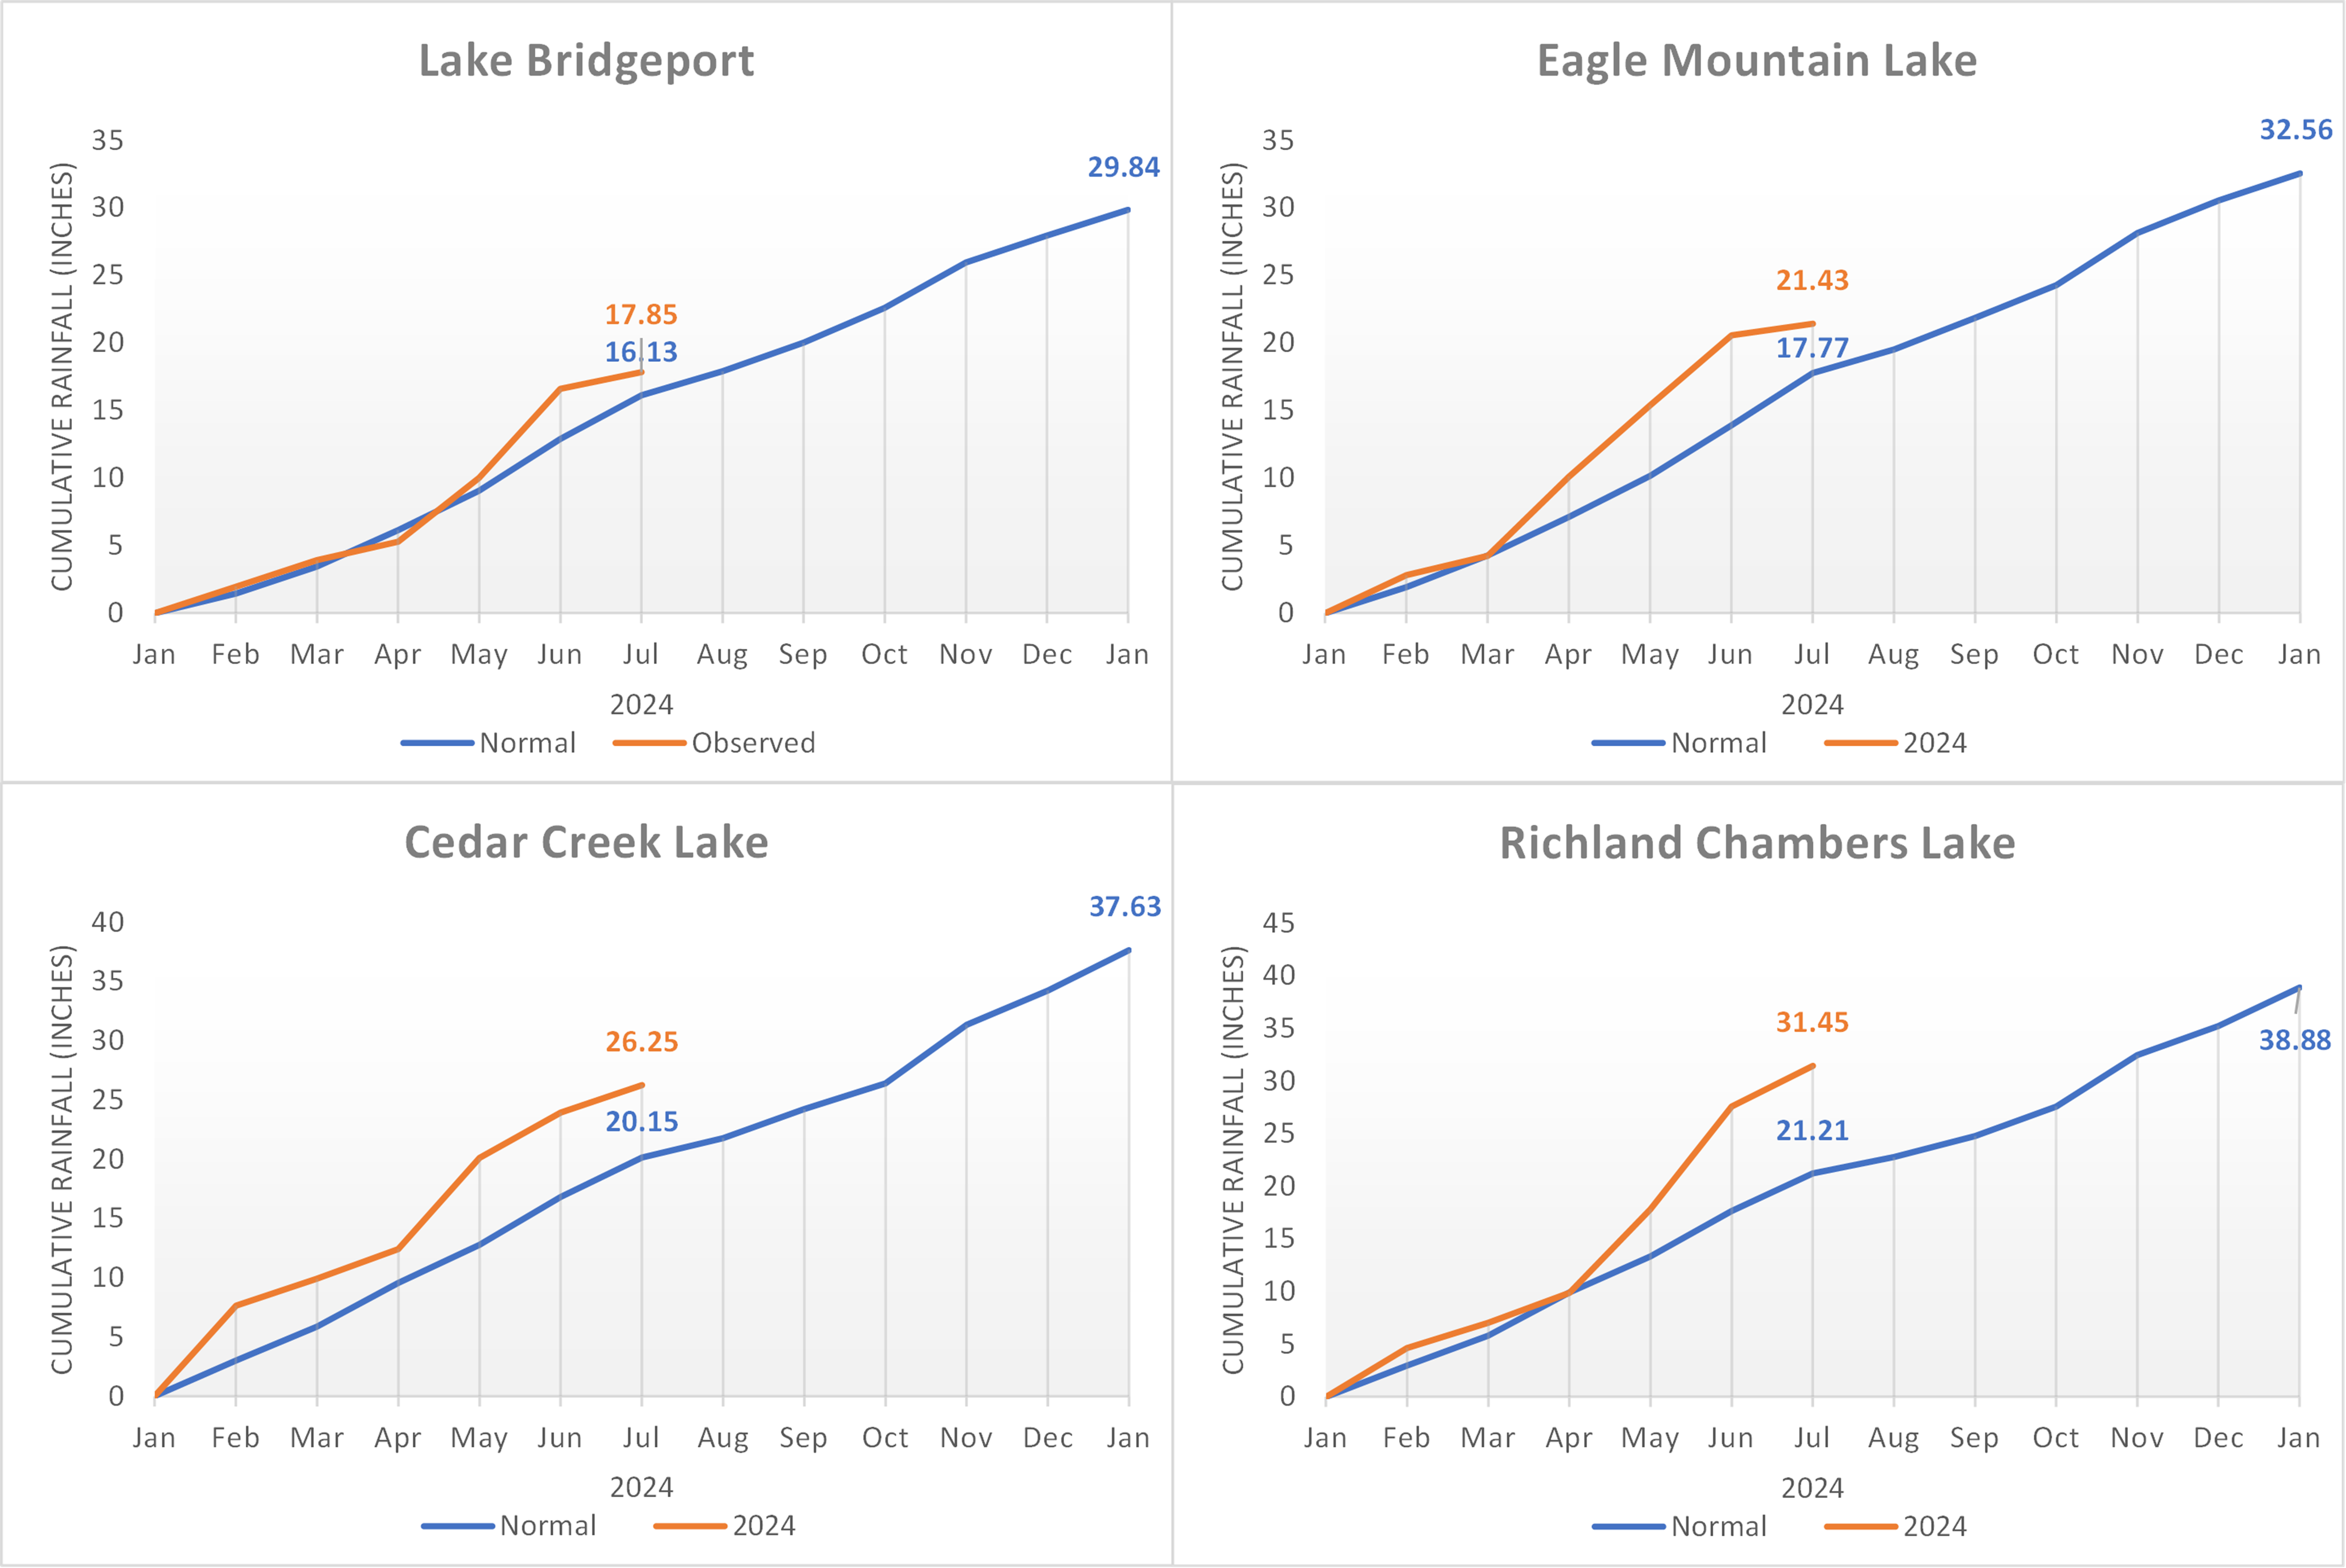
Projections
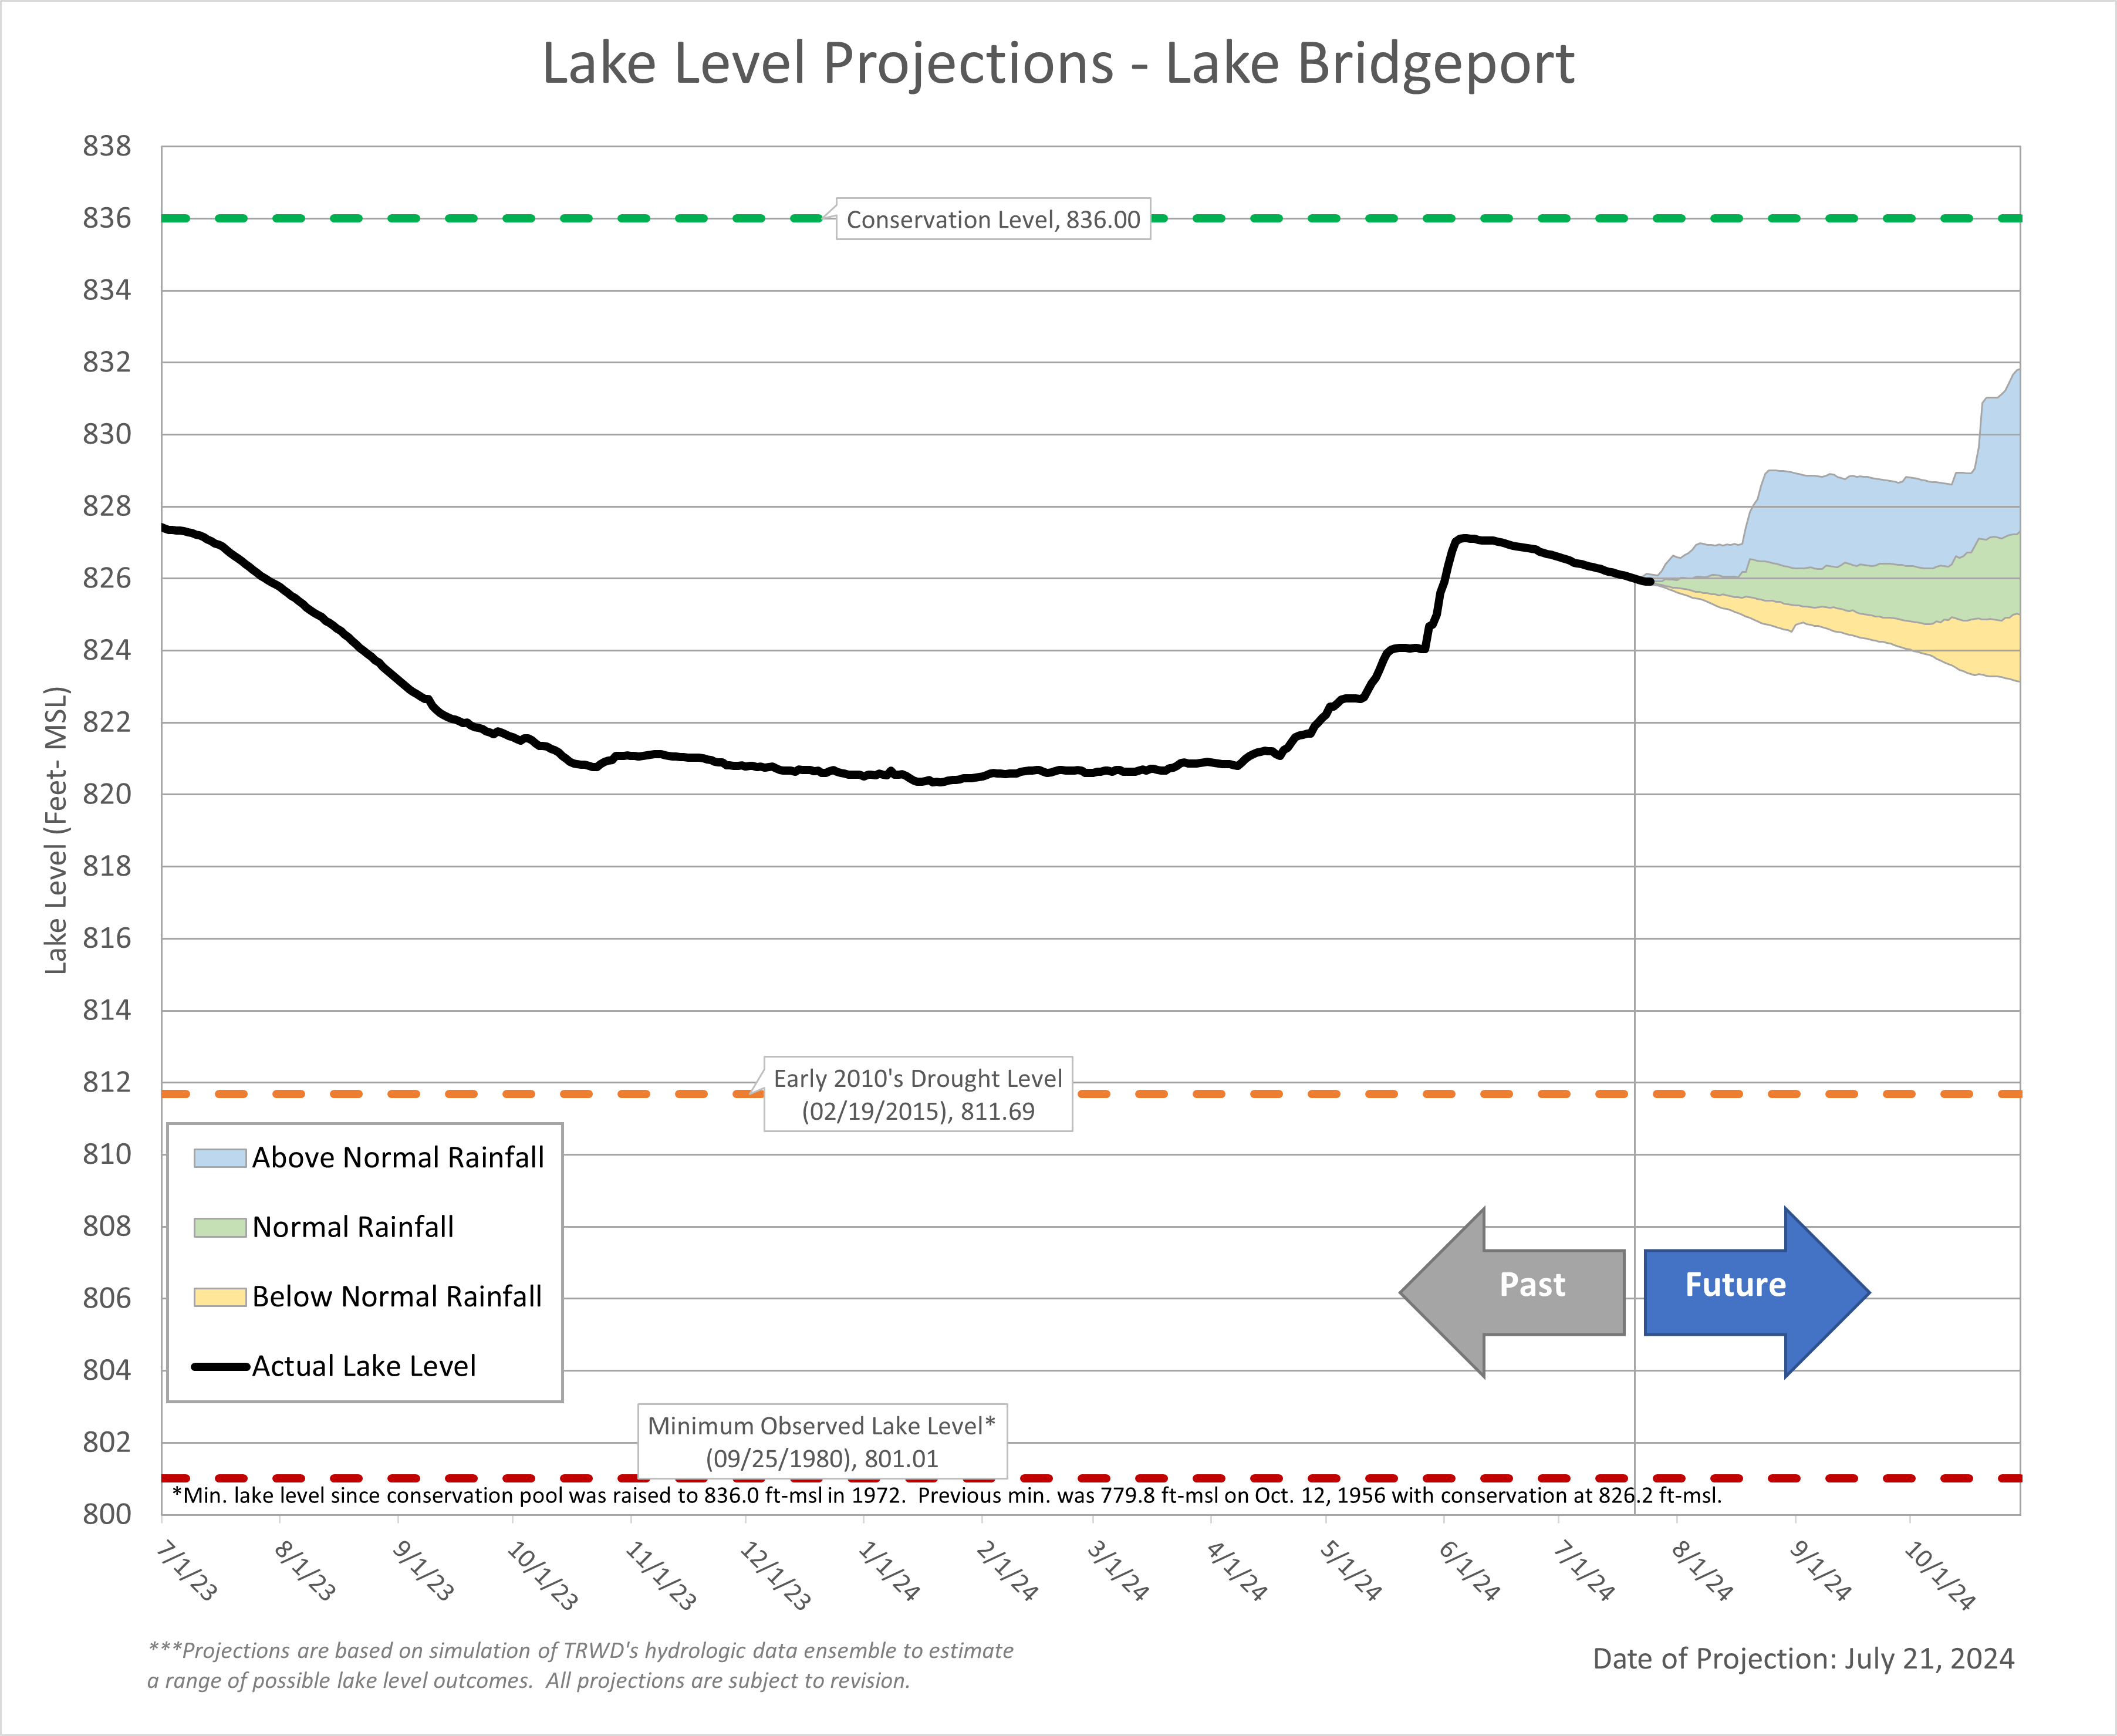
Lake Bridgeport
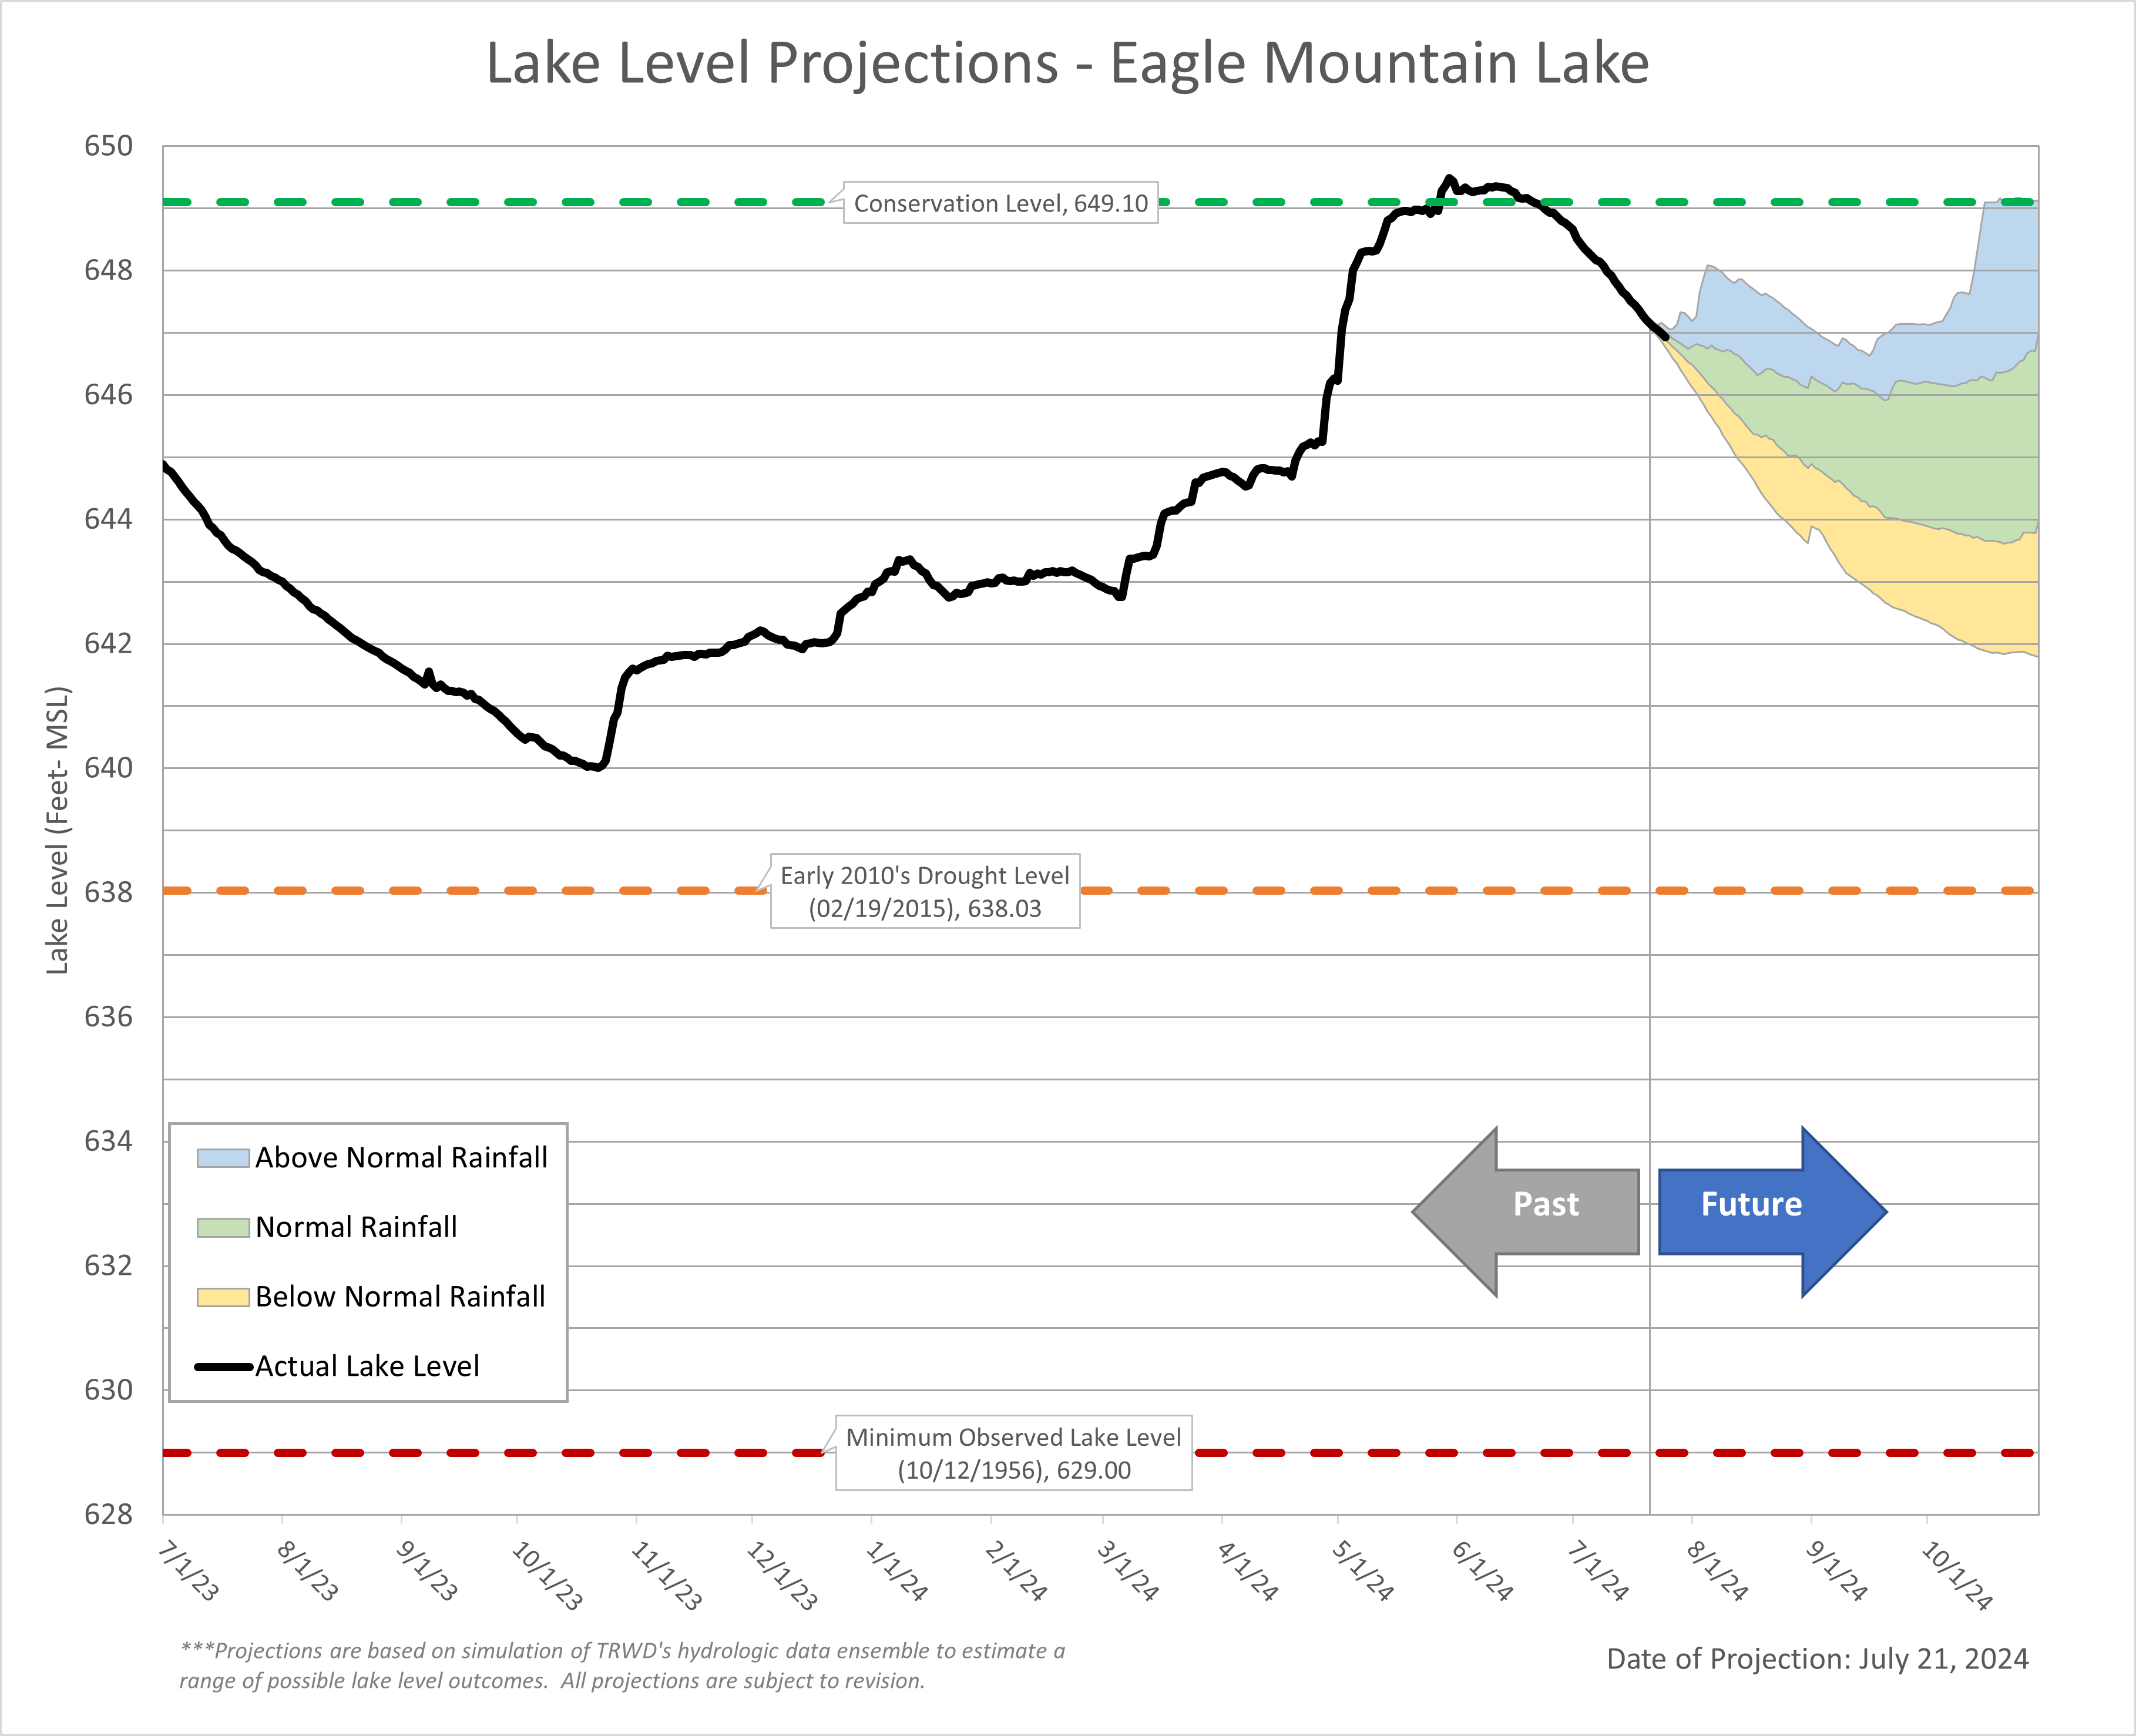
Eagle Mountain Lake
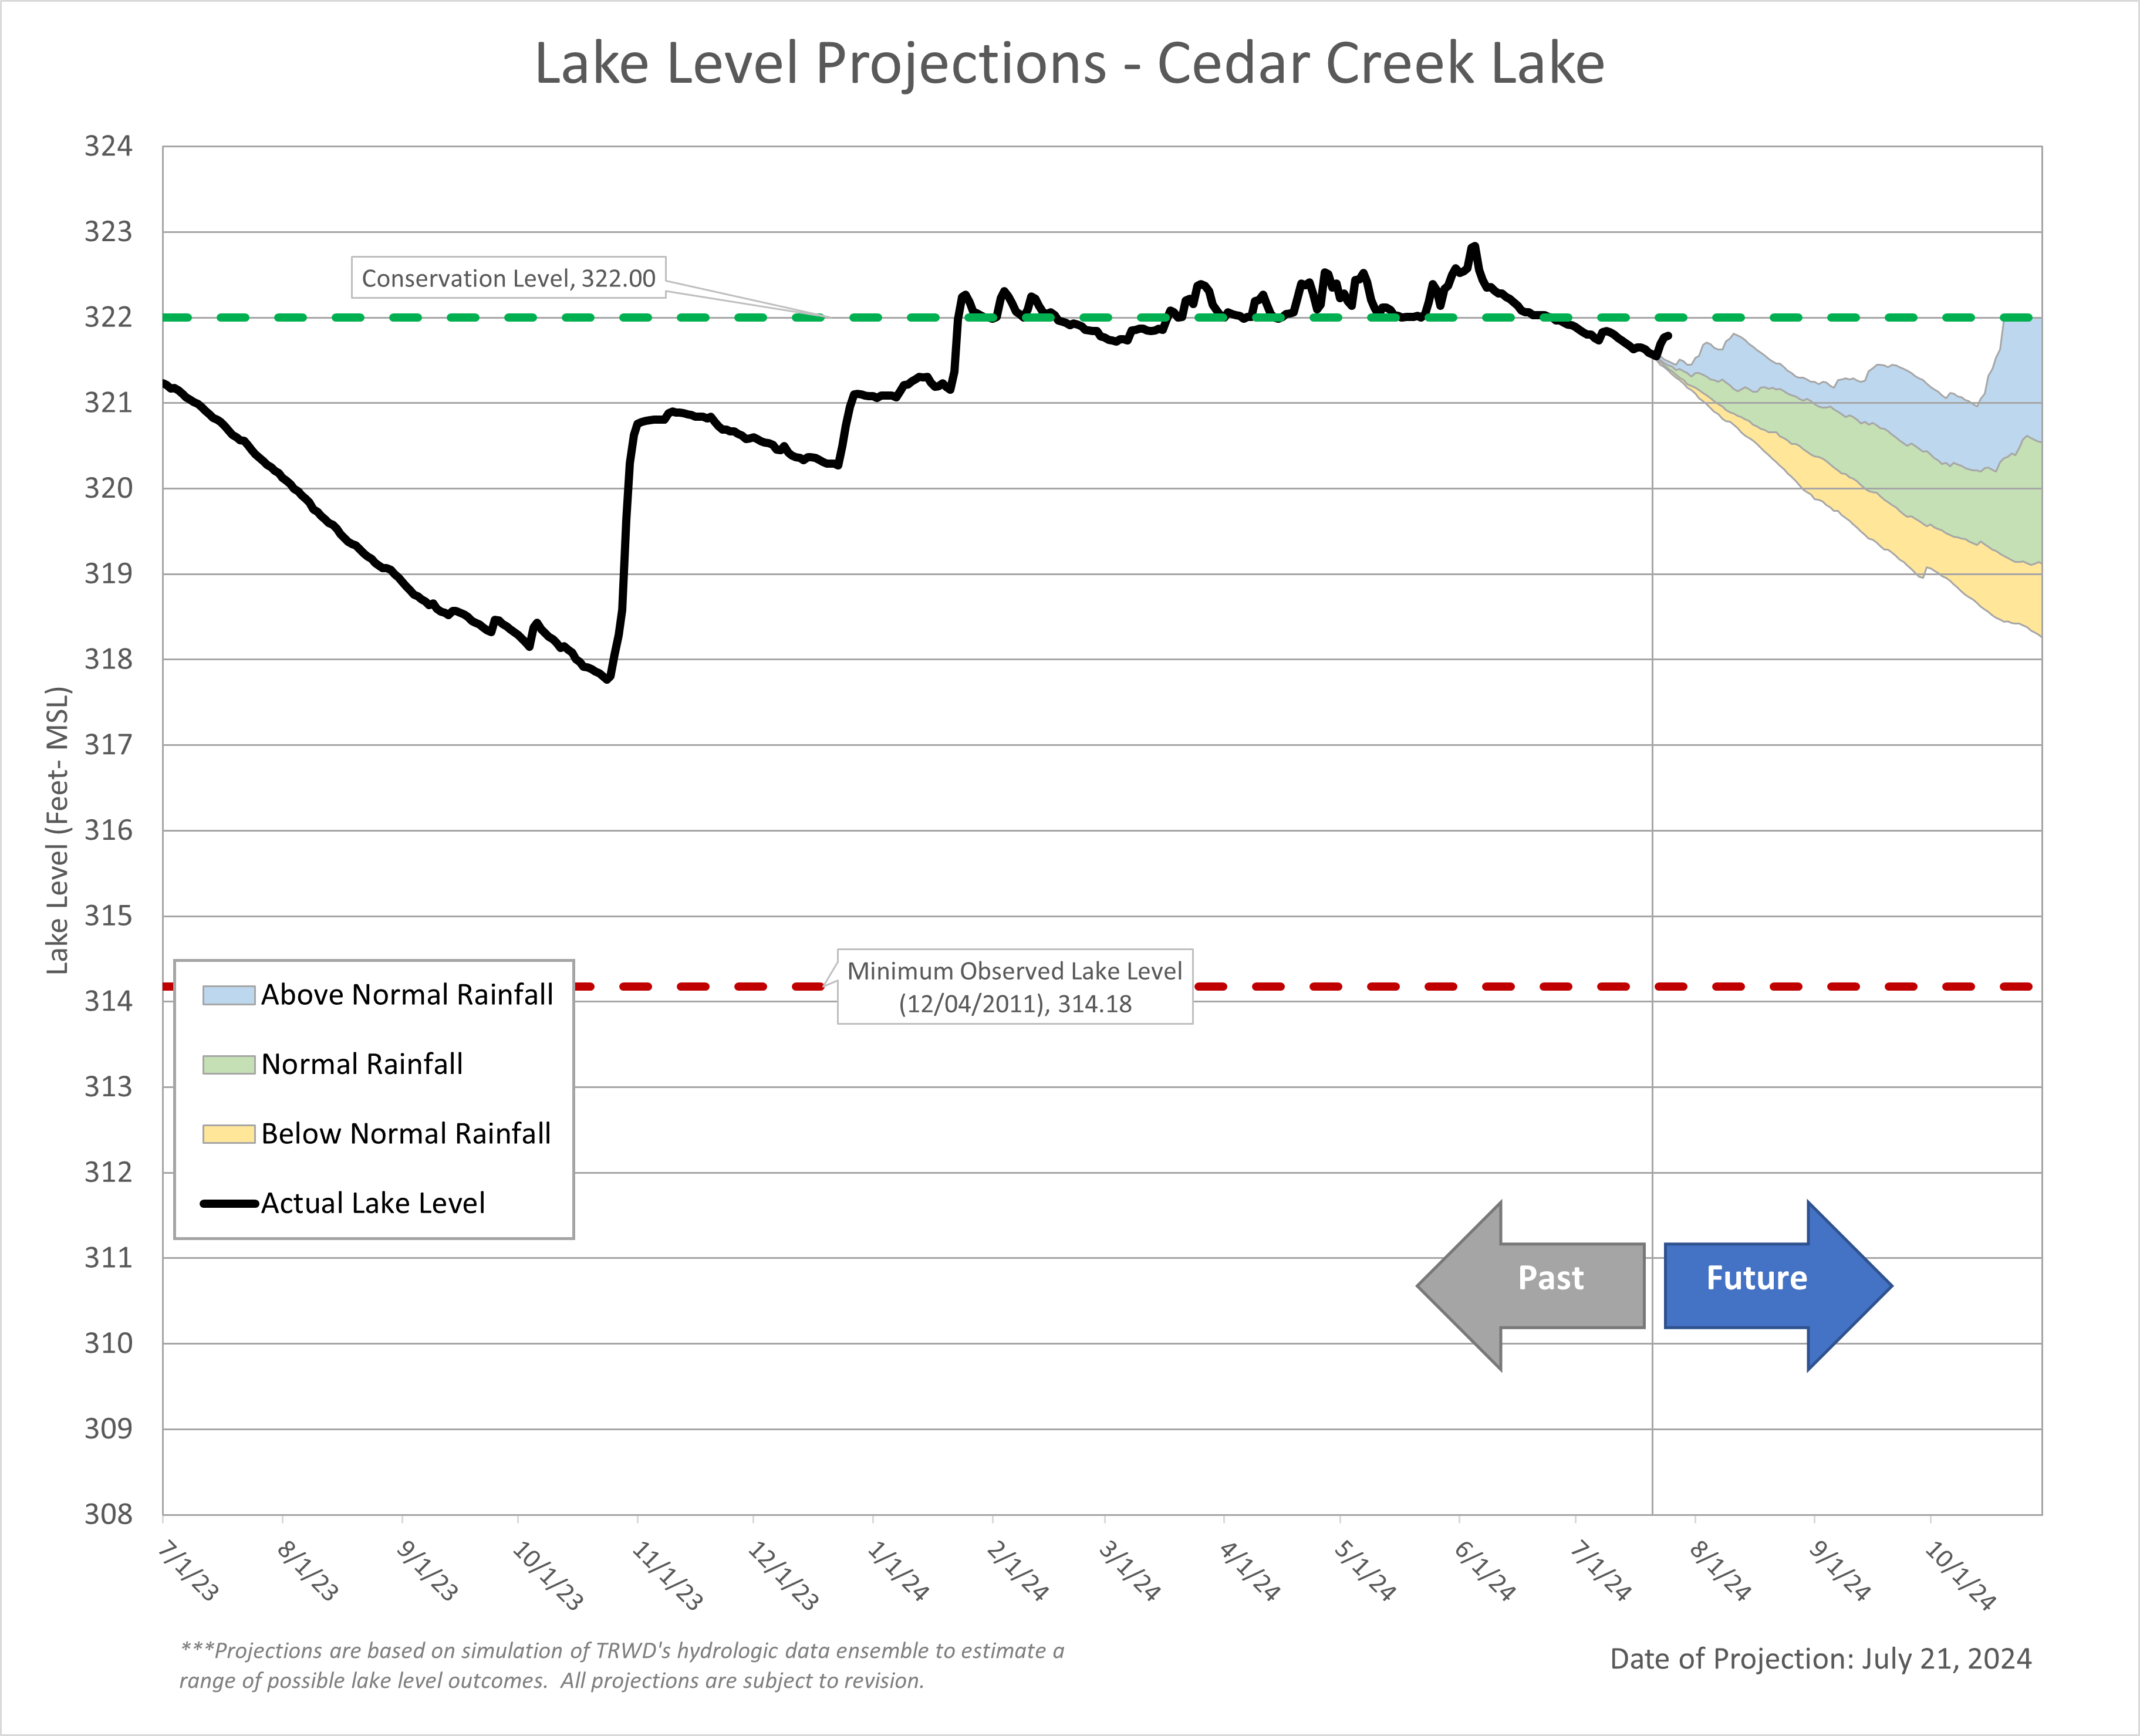
Cedar Creek Lake
Richland-Chambers Lake