March was warmer and drier than average across most of the TRWD service area. Rain over Cedar Creek and Richland-Chambers lakes kept the system storage to remain steady, ending the month at 94% full, the same as February.
Highlights:
- Temperature: Meteorological spring has begun with temperatures 5 to 6 degrees above normal for the month of March.
- Rainfall: March rains were below average for most of the region. DFW received 1.67” of rainfall which is 1.53” below normal. The Bridgeport and Eagle Mountain watersheds received about half of their usual amount. Cedar Creek and Richland Chambers were the exception, receiving near normal rain as shown in the 30-Day Rainfall Total map below.
- Drought Conditions: Drought intensity classifications have increased across the North Texas region due to lack of rainfall. See drought monitor map. TRWD’s West Fork is mostly in the abnormally dry (D0) category, with Lake Bridgeport and parts of its watershed now moderate drought zone (D1). The Richland Chambers watershed is also abnormally dry (D0), while Cedar Creek remains without a drought intensity rating.
Looking Ahead:
- April Forecast: Multiple rounds of storms with heavy rain are possible early in the month. Overall, April is expected to be warmer than normal with slightly above-normal rainfall.
- Spring Outlook: Although La Niña is weakening and transitioning to ENSO neutral conditions, its influence is likely to persist through the April-May-June season. This is expected to result in below-normal precipitation and above-normal temperatures across the Central to Southern Great Plains.
Stay Informed:
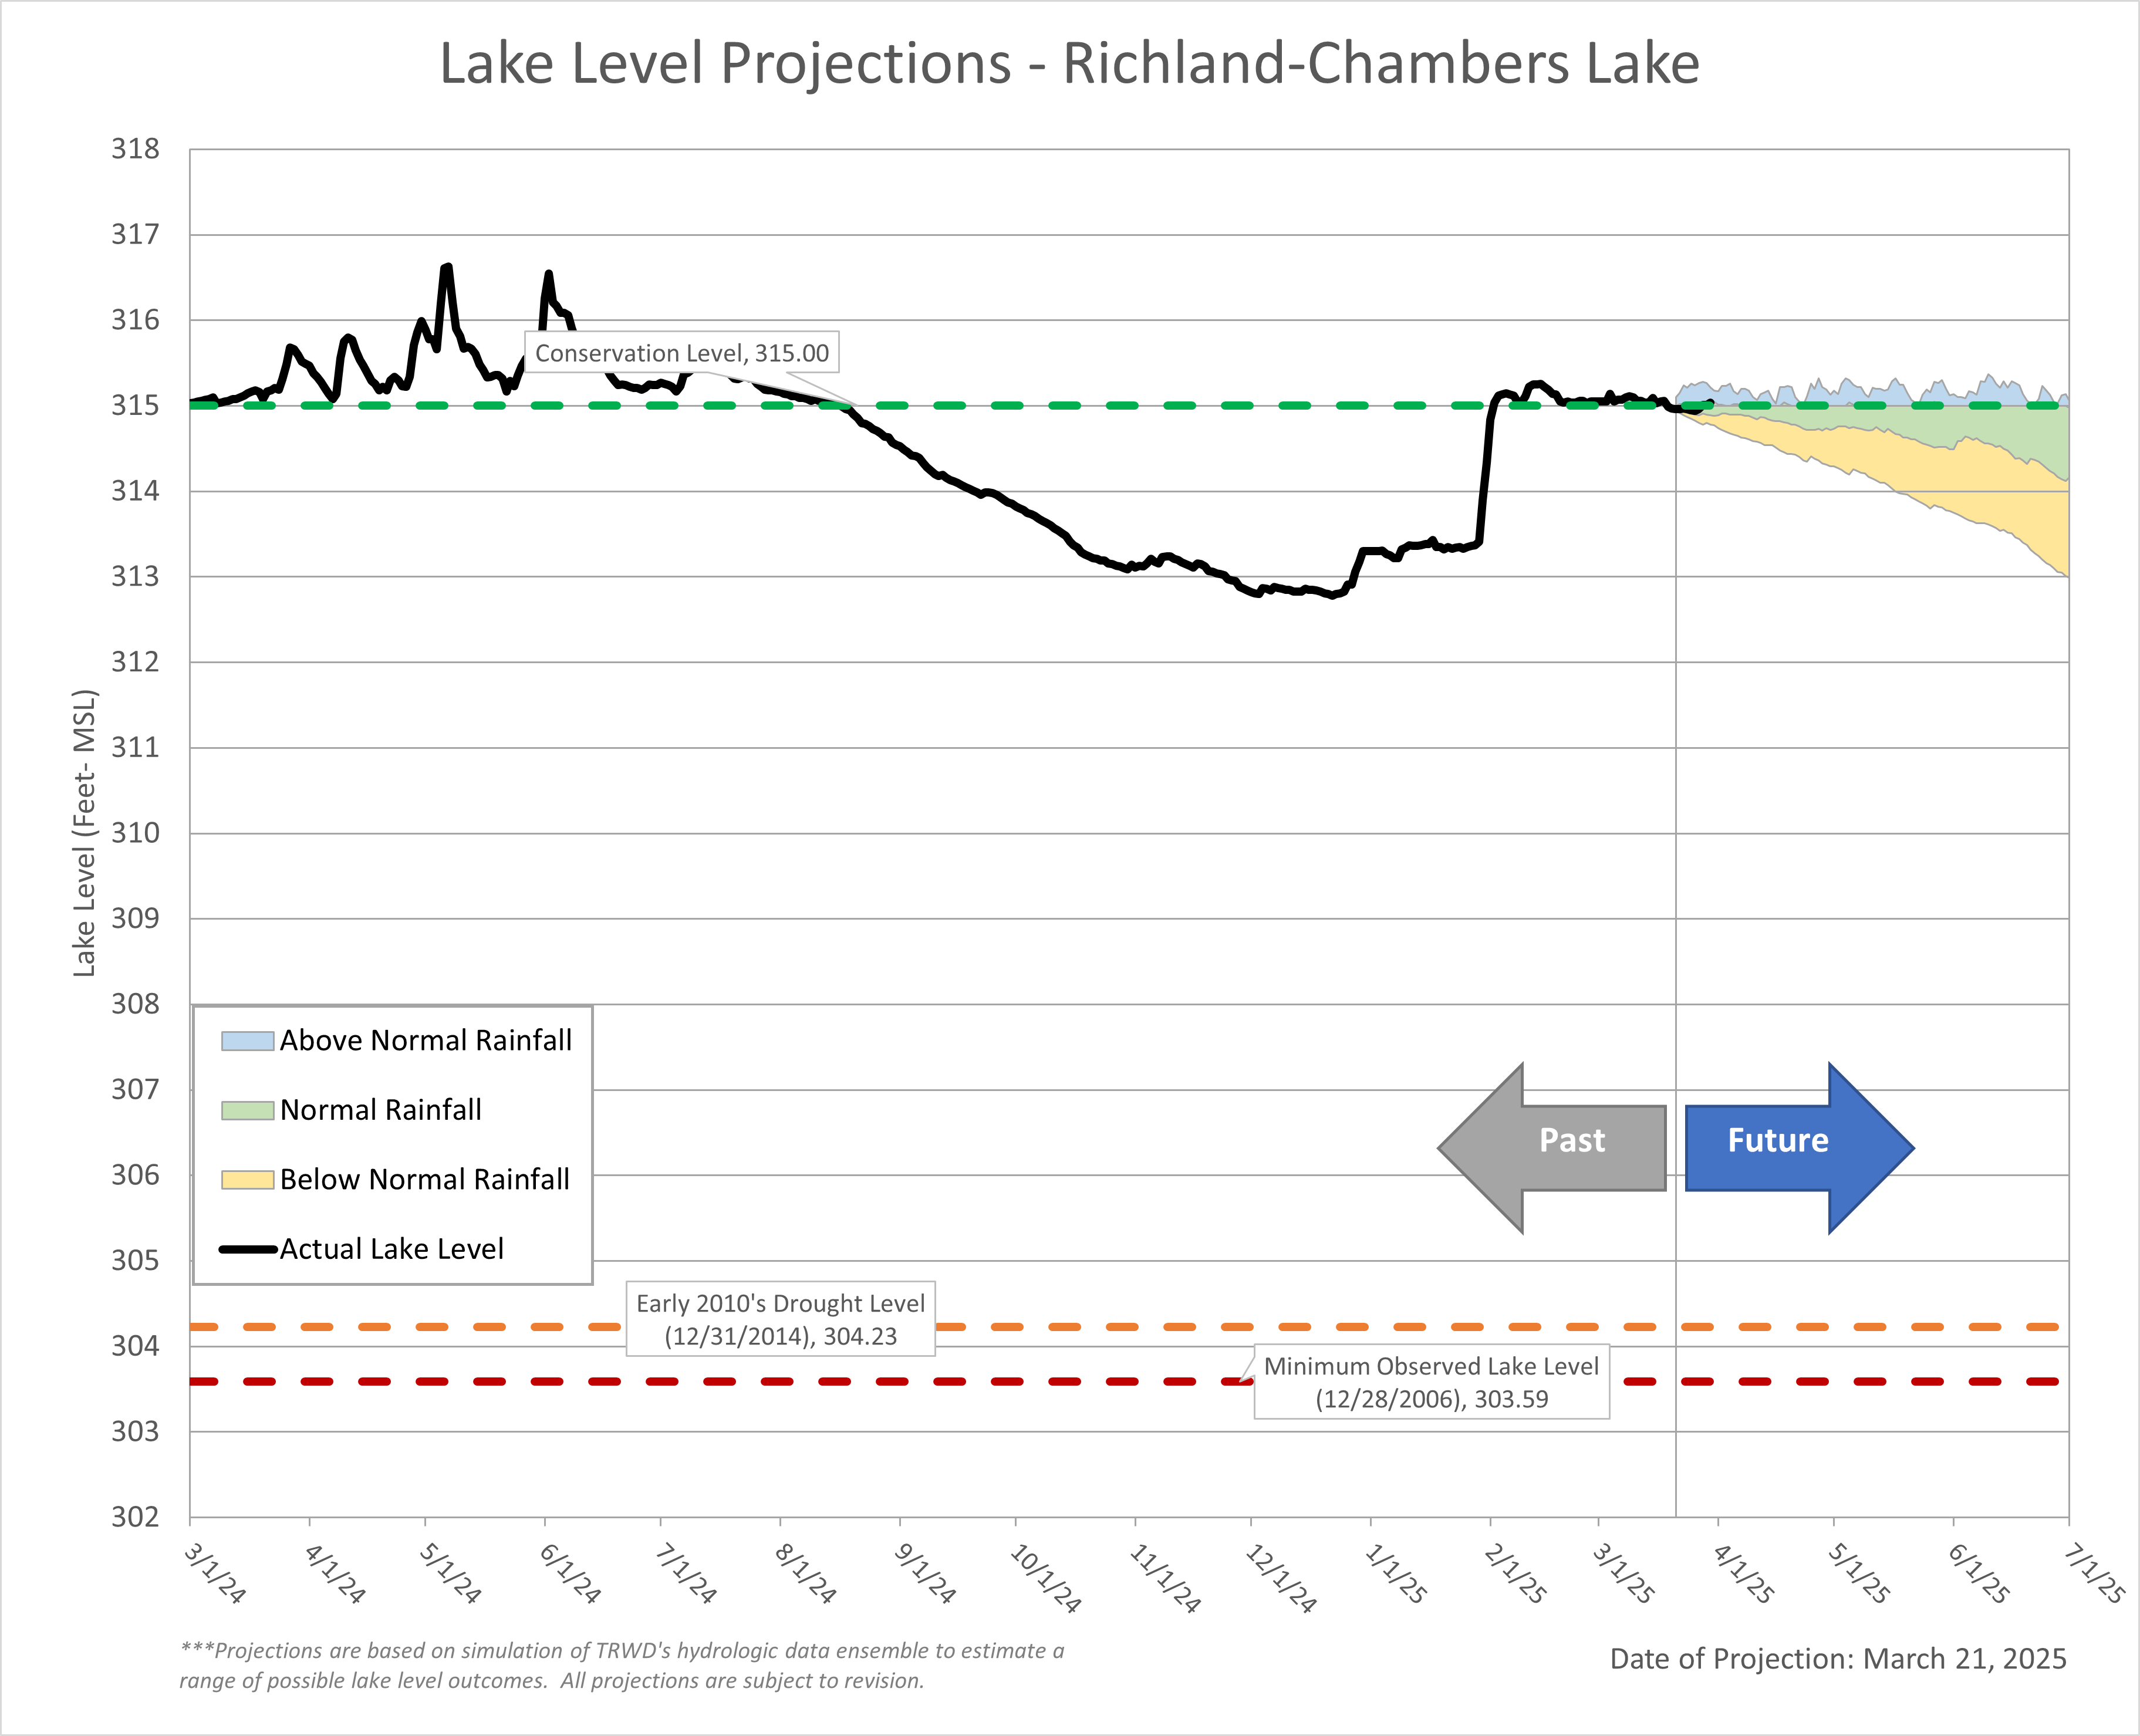
- Check out the latest lake level projections below.
- Links to historical lake level plots.
- Last month’s projections compared to actual outcomes.
Thank you for following the Lake Level Blog. Check back next month for more updates!
TRWD Watershed Rainfall
30-Day Rainfall Totals
TRWD Lake Rainfall Totals through March 30, 2025
Lake Level Projection
Lake Bridgeport
Eagle Mountain Lake

Cedar Creek Lake
Richland-Chambers Lake
Acknowledgments:
- Weather Insights: Special thanks to Courtney Jalbert, TRWD’s Meteorologist, for providing detailed weather insights and forecasts.
- Reservoir Projections: A big thank you to Vini de Oliveira for his timely reservoir projections.
- Rainfall Analysis: Appreciation goes to Ashley Lowrie for her thorough analysis of observed rainfall.