January was a wild weather ride for North Texas, with above-normal temperatures, snowfall, and heavy rains. The January precipitation helped increase TRWD’s System Storage by about 1.5%, bringing it to 89%. TRWD’s Meteorologist, Courtney Jalbert, provides insights on what we can expect in terms of rainfall and temperatures in the coming months and their impacts on lake levels in the “From our Meteorologist” section.
The latest lake level projections are shown below. You will also find:
- Links to historical lake level plots
- Last month’s projections compared to actual outcomes
Thank you for following the Lake Level Blog. Check back next month for more projections.
From our Meteorologist
January Summary…
30-Day Rainfall Totals
With the snowfall and rainfall, drought intensity remains absent or in the D0 (abnormally dry) category for the TRWD watershed, as seen on the latest local drought intensity map.
TRWD Lake Rainfall Totals through January 31, 2025
Looking ahead…
February is expected to start warm, then turn slightly below to near normal by mid-month with the passing of a cold front and some Arctic air. However, February is expected to be warmer than average, as seen in the 1-Month Temperature Outlook. Precipitation looks to be minimal in North Texas through the same periods but slightly higher by mid-February. We expect to close out the month leaning toward below-normal conditions, as seen in the latest 1-Month Precipitation Outlook.
A warmer and drier trend is expected from now into early spring, as seen in the latest climate models for the February-March-April Temperature Outlook and the February-March-April Precipitation Outlook. This below-normal precipitation and above-normal temperature forecast across the Central to Southern Great Plains is due to the La Niña conditions that are present and expected to persist through April 2025, in addition to current trends and soil moisture. After that, a transition to ENSO neutral conditions is most likely as we head into late spring.
Projections
Lake Bridgeport
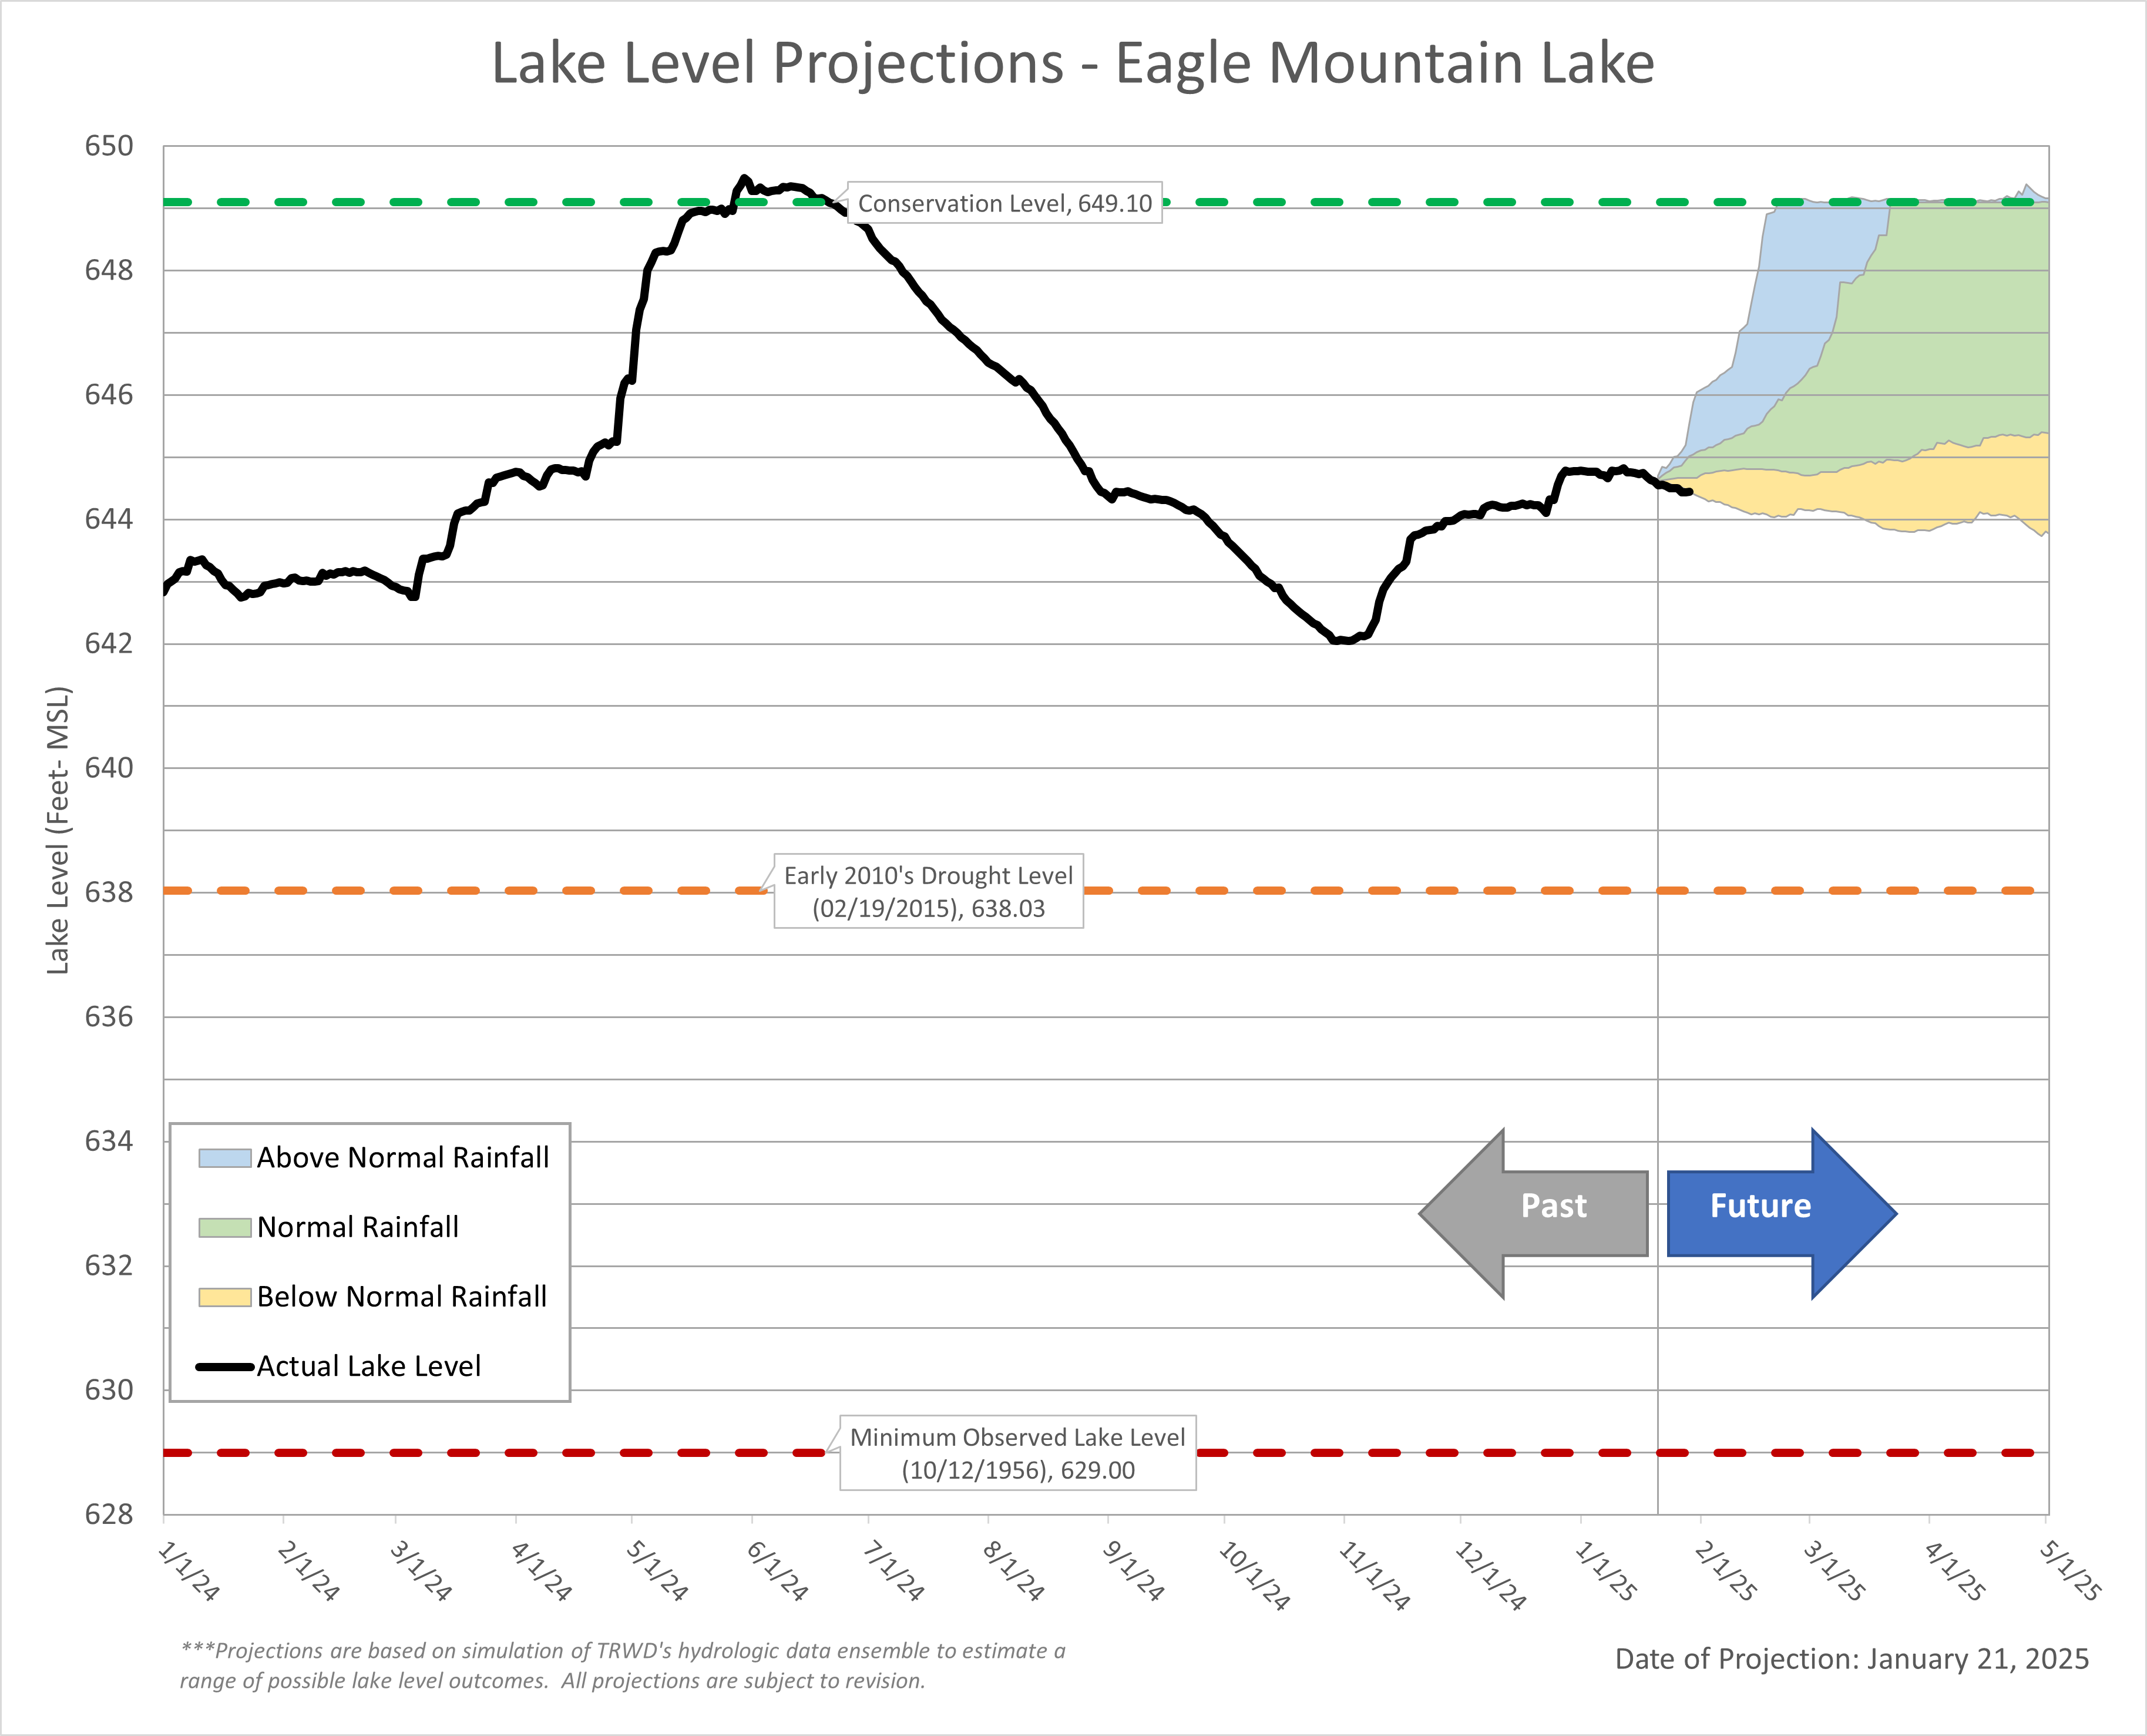
Eagle Mountain Lake
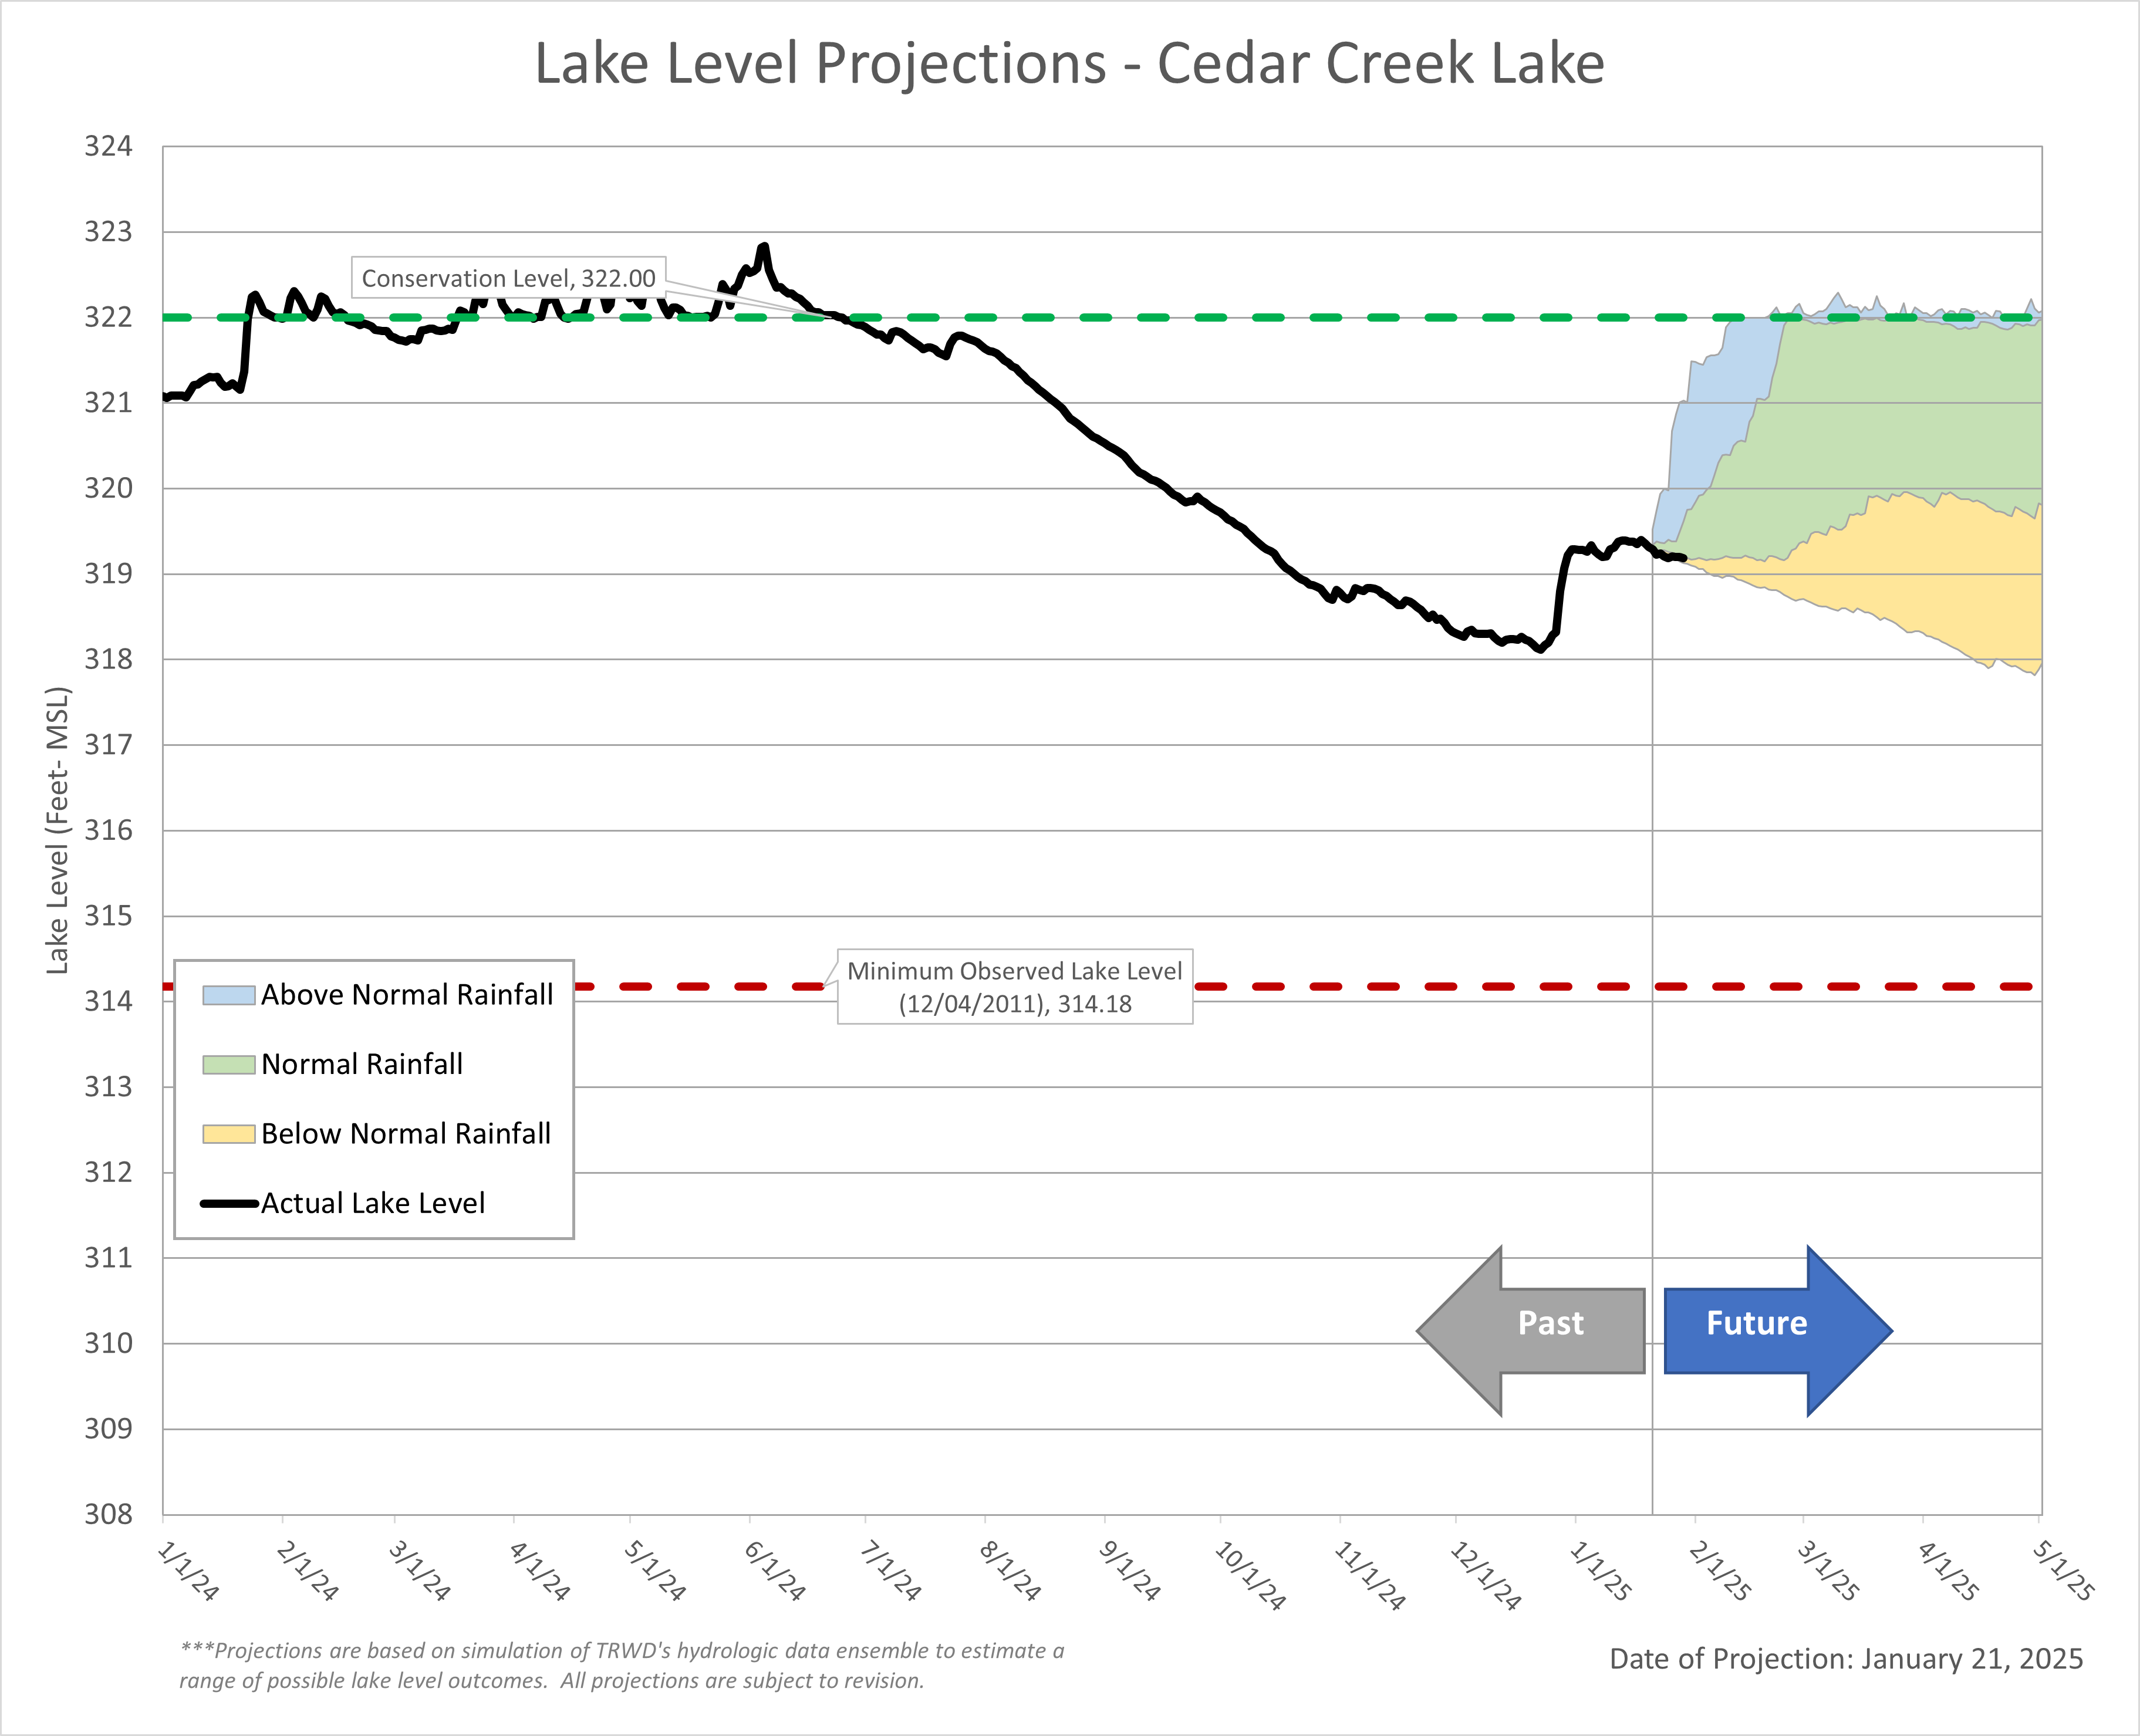
Cedar Creek Lake
Richland-Chambers Lake