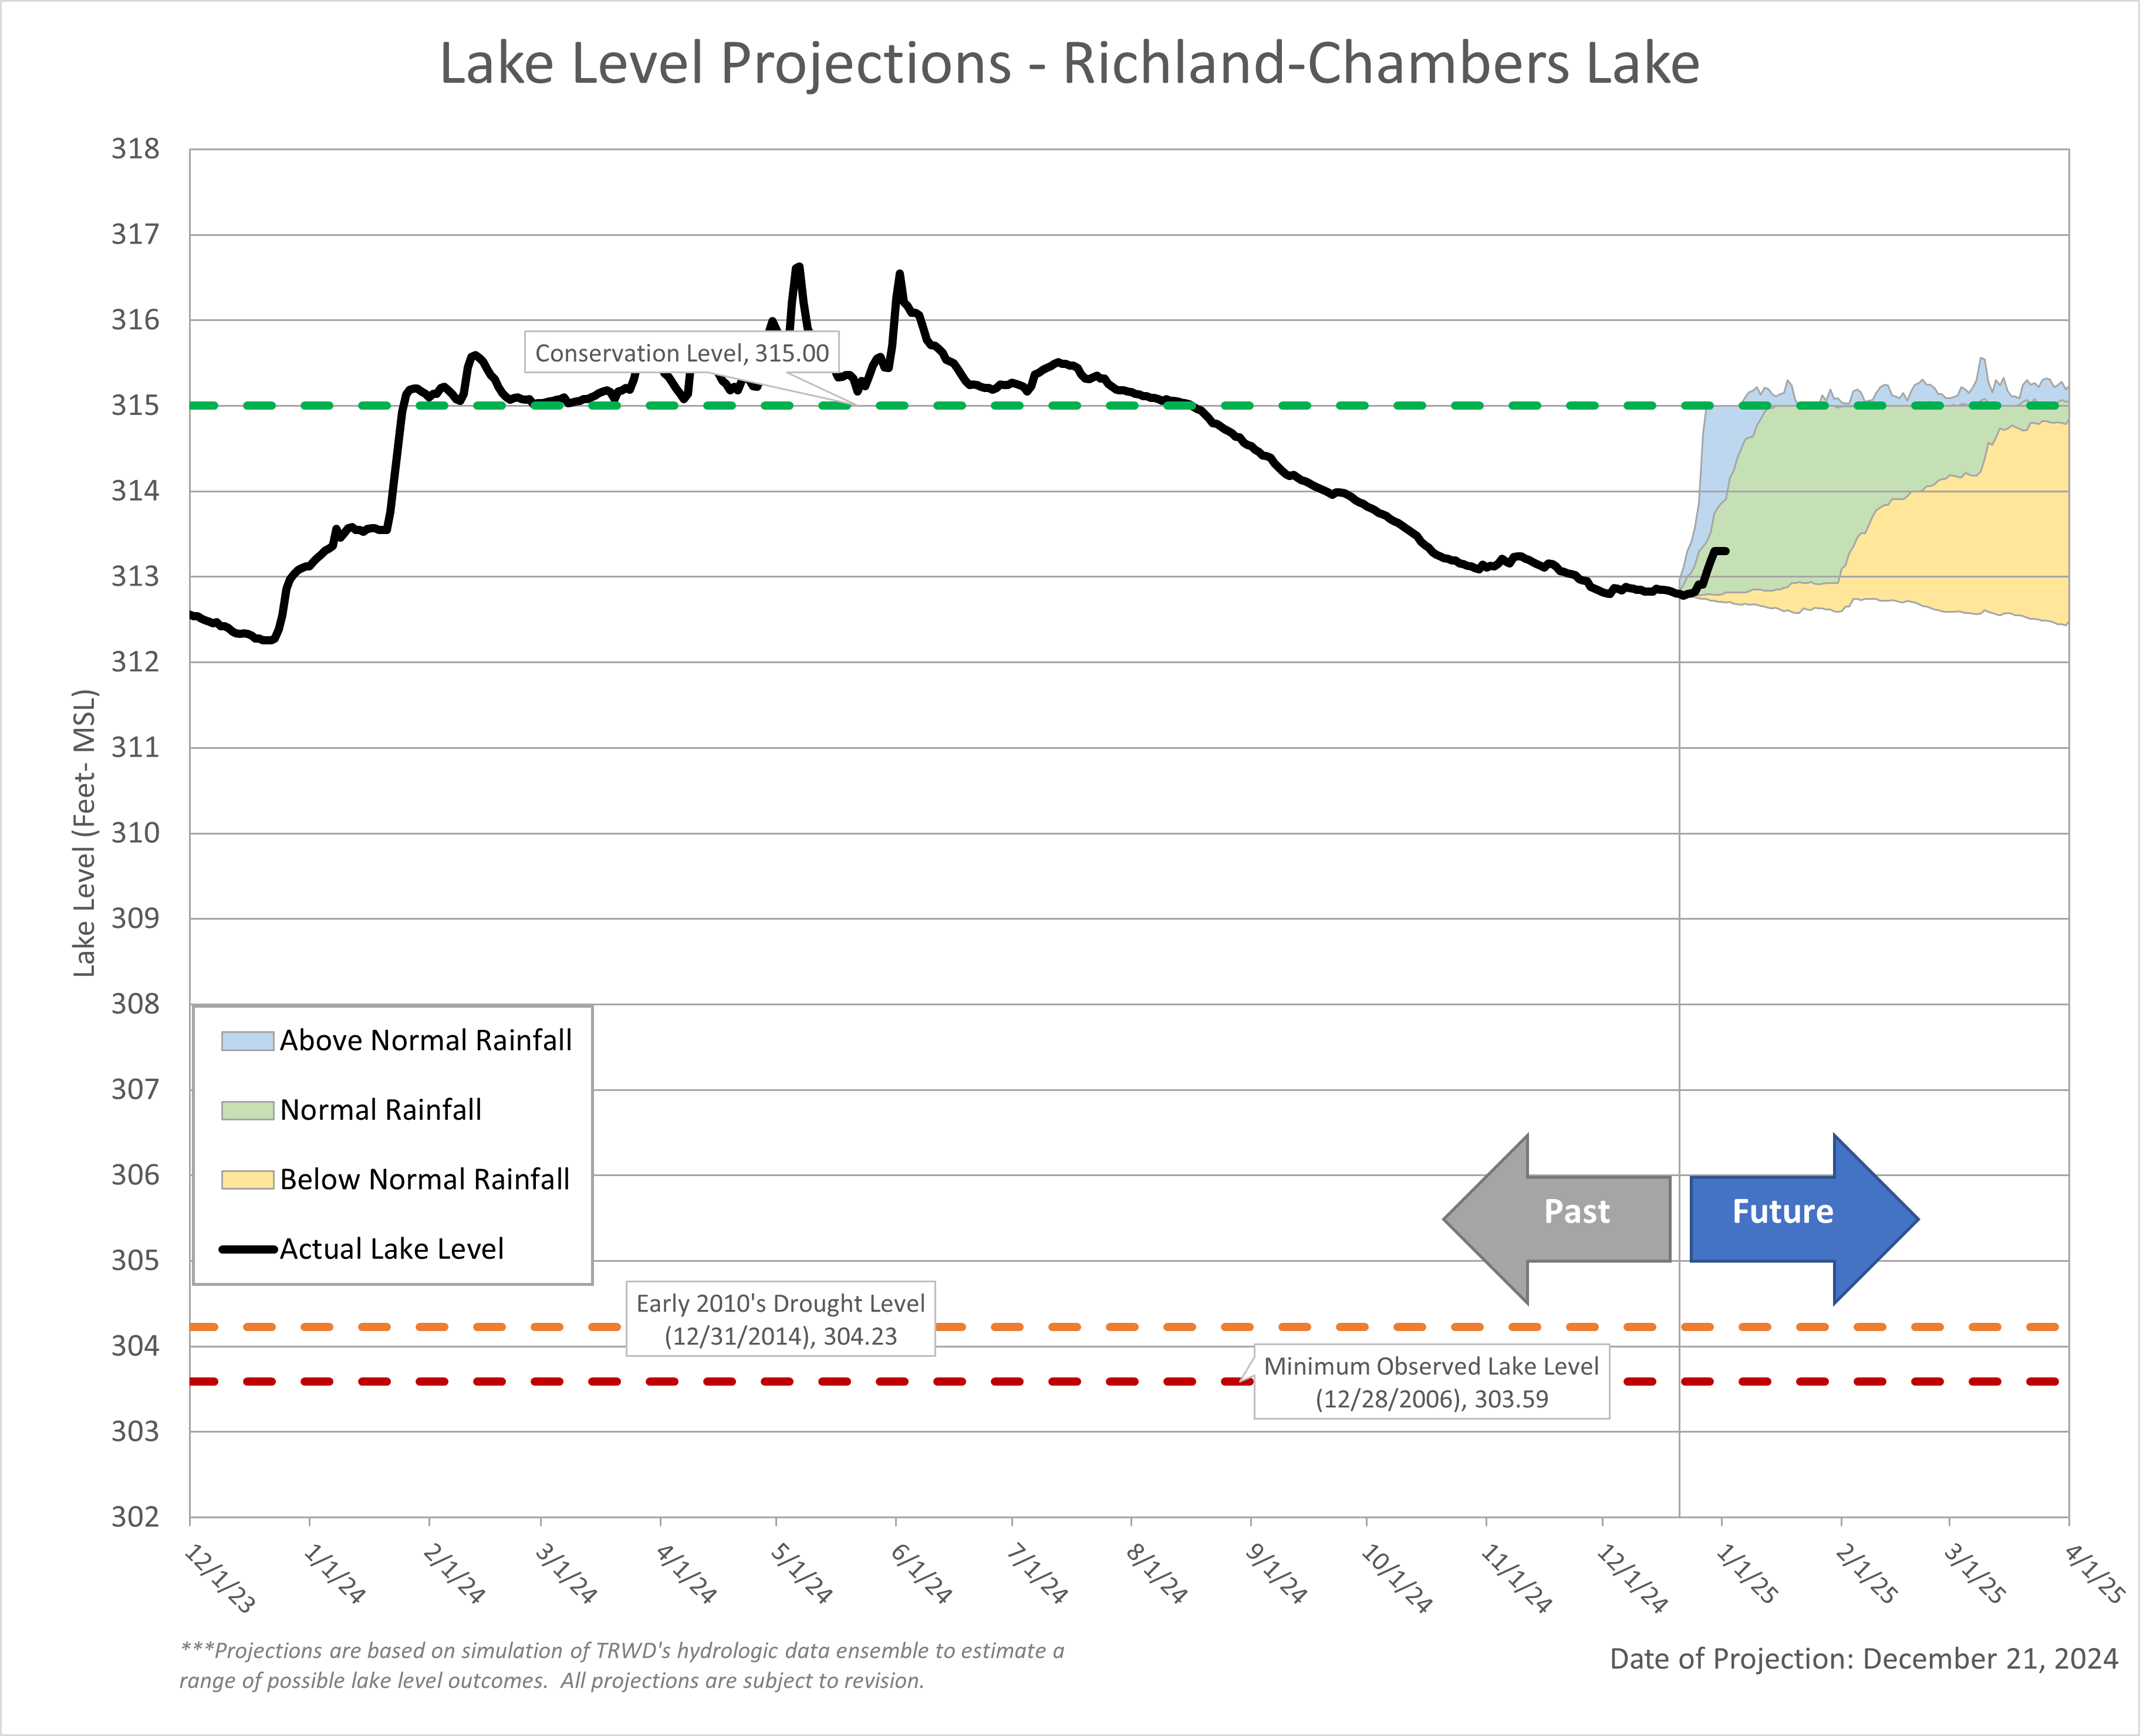
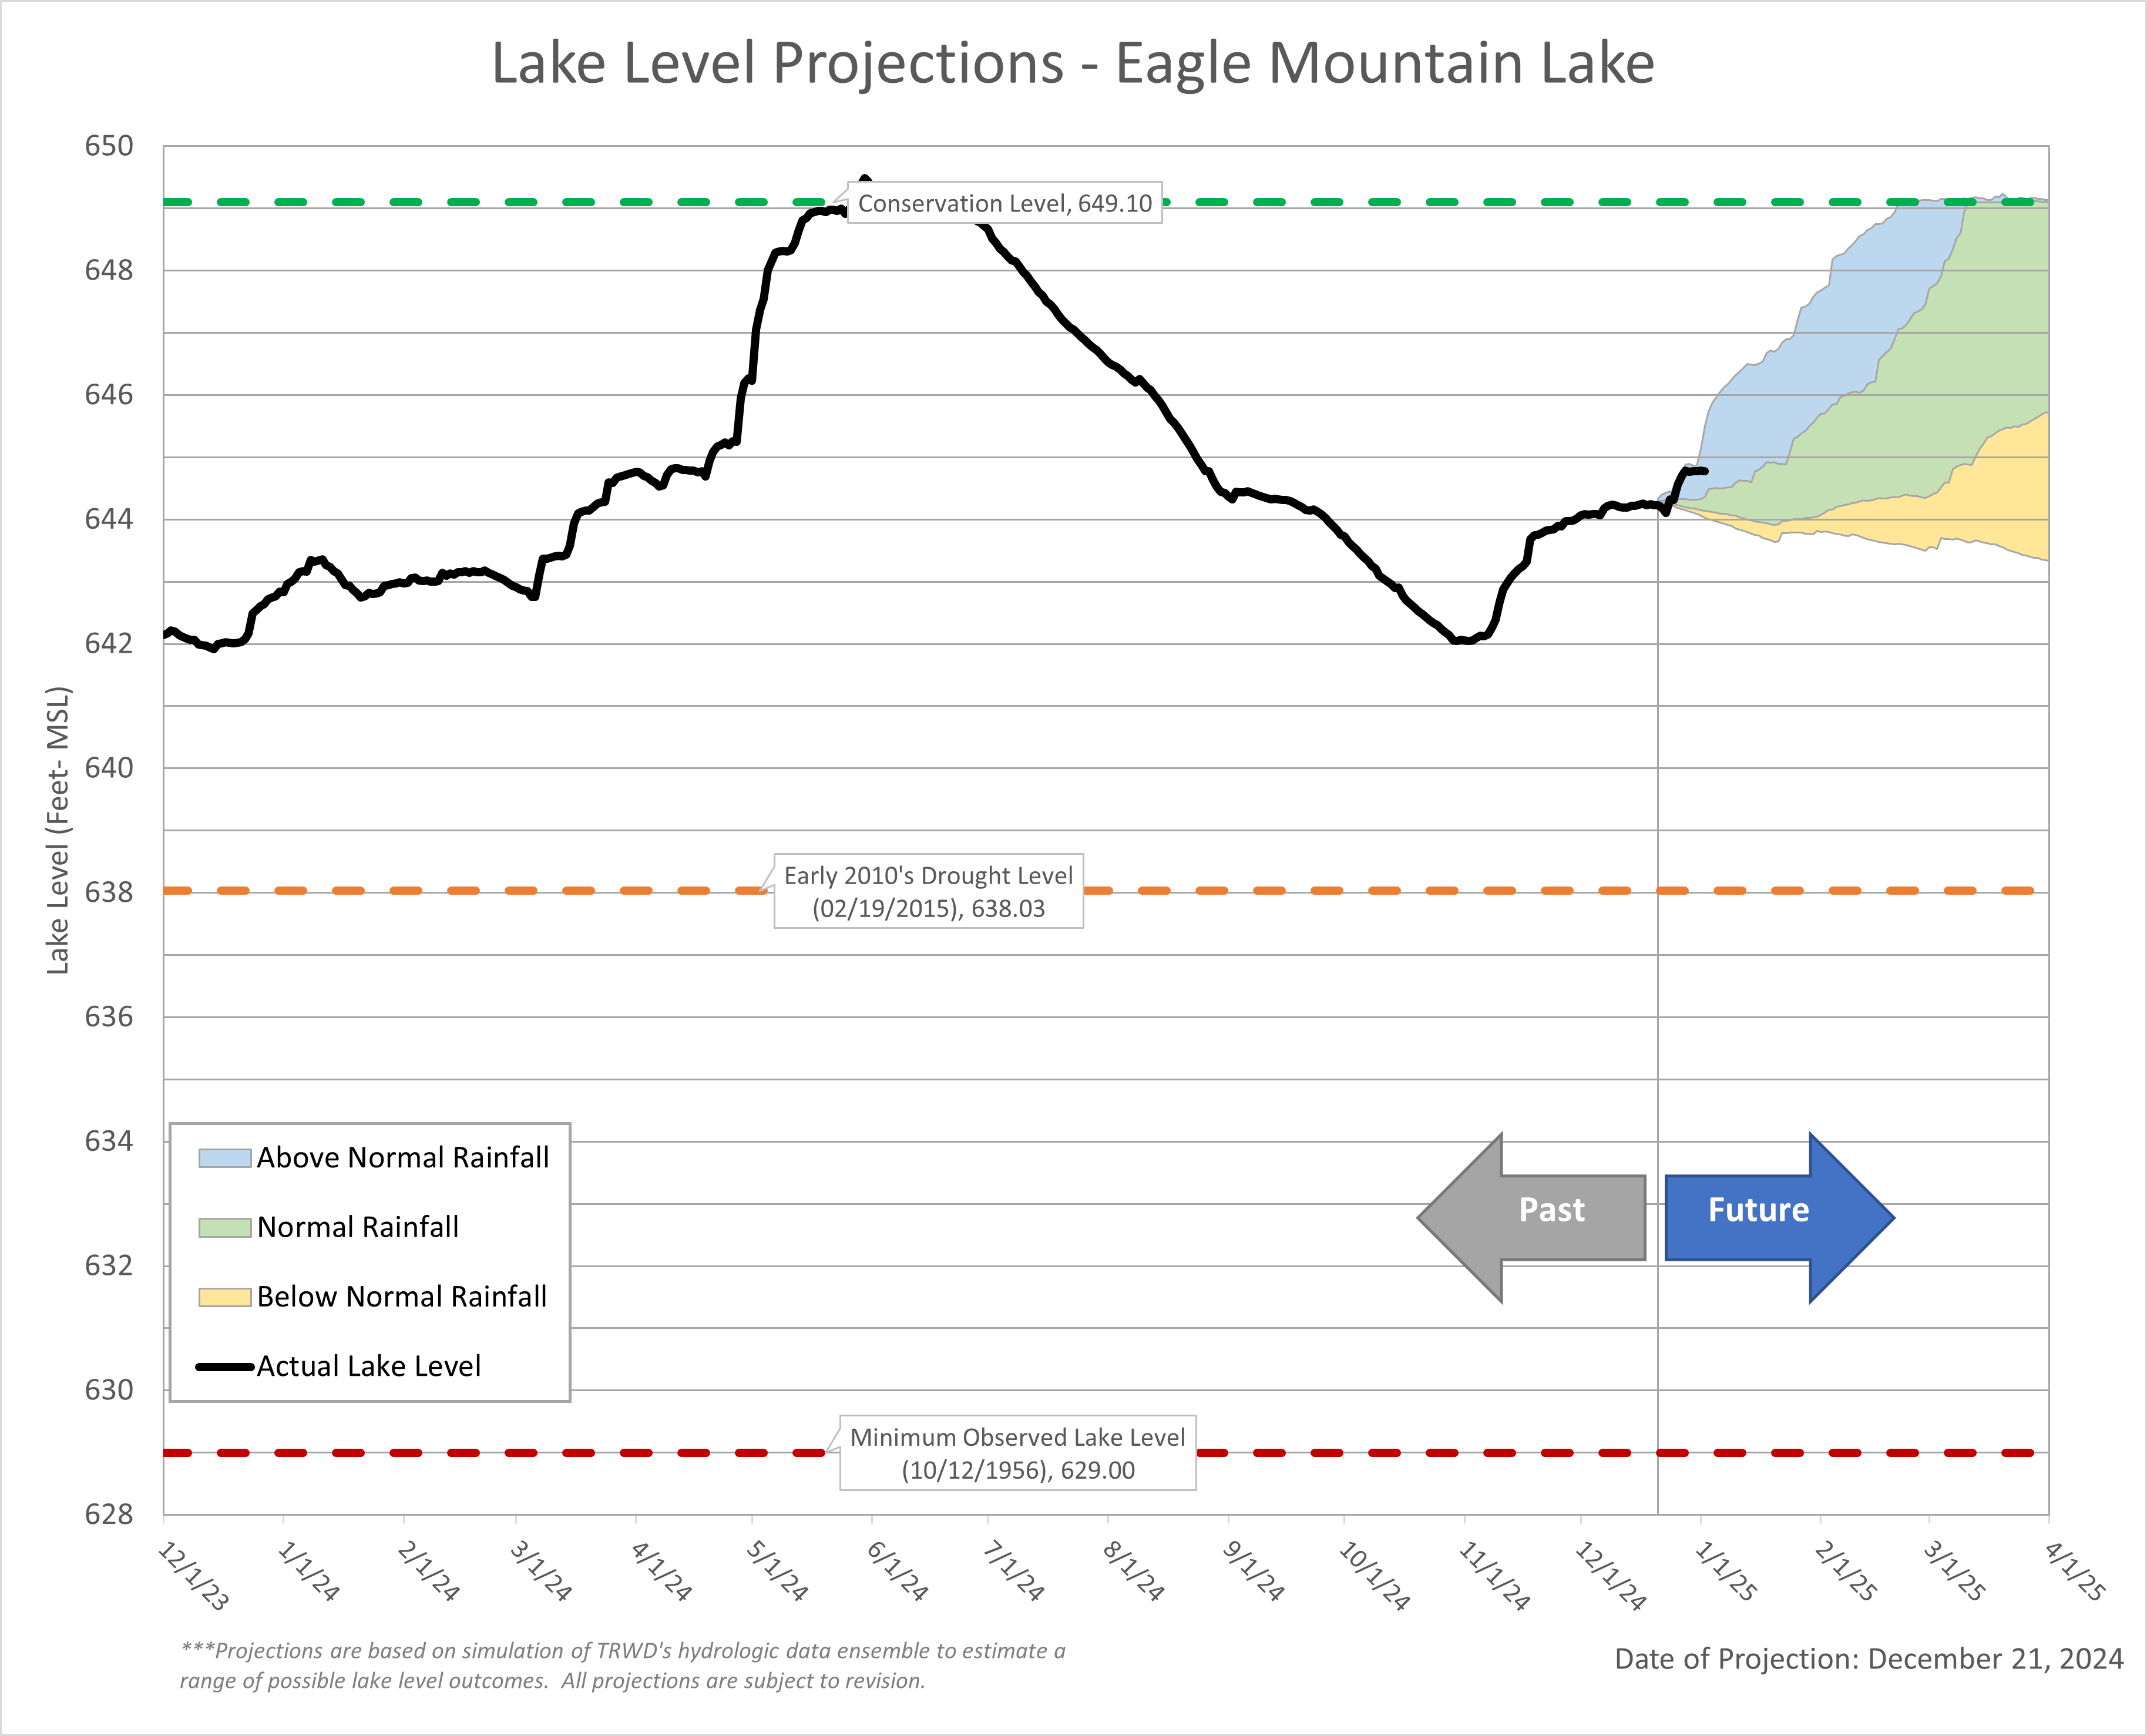
December rains helped replenish TRWD lakes, especially Cedar Creek and Richland-Chambers. Overall, TRWD’s System Storage increased by 2% and is currently at 87%. TRWD’s Meteorologist, Courtney Jalbert, provides information on what we can expect in terms of rainfall and temperatures going into the next couple of months and their impacts to lake levels in the “From our Meteorologist” section.
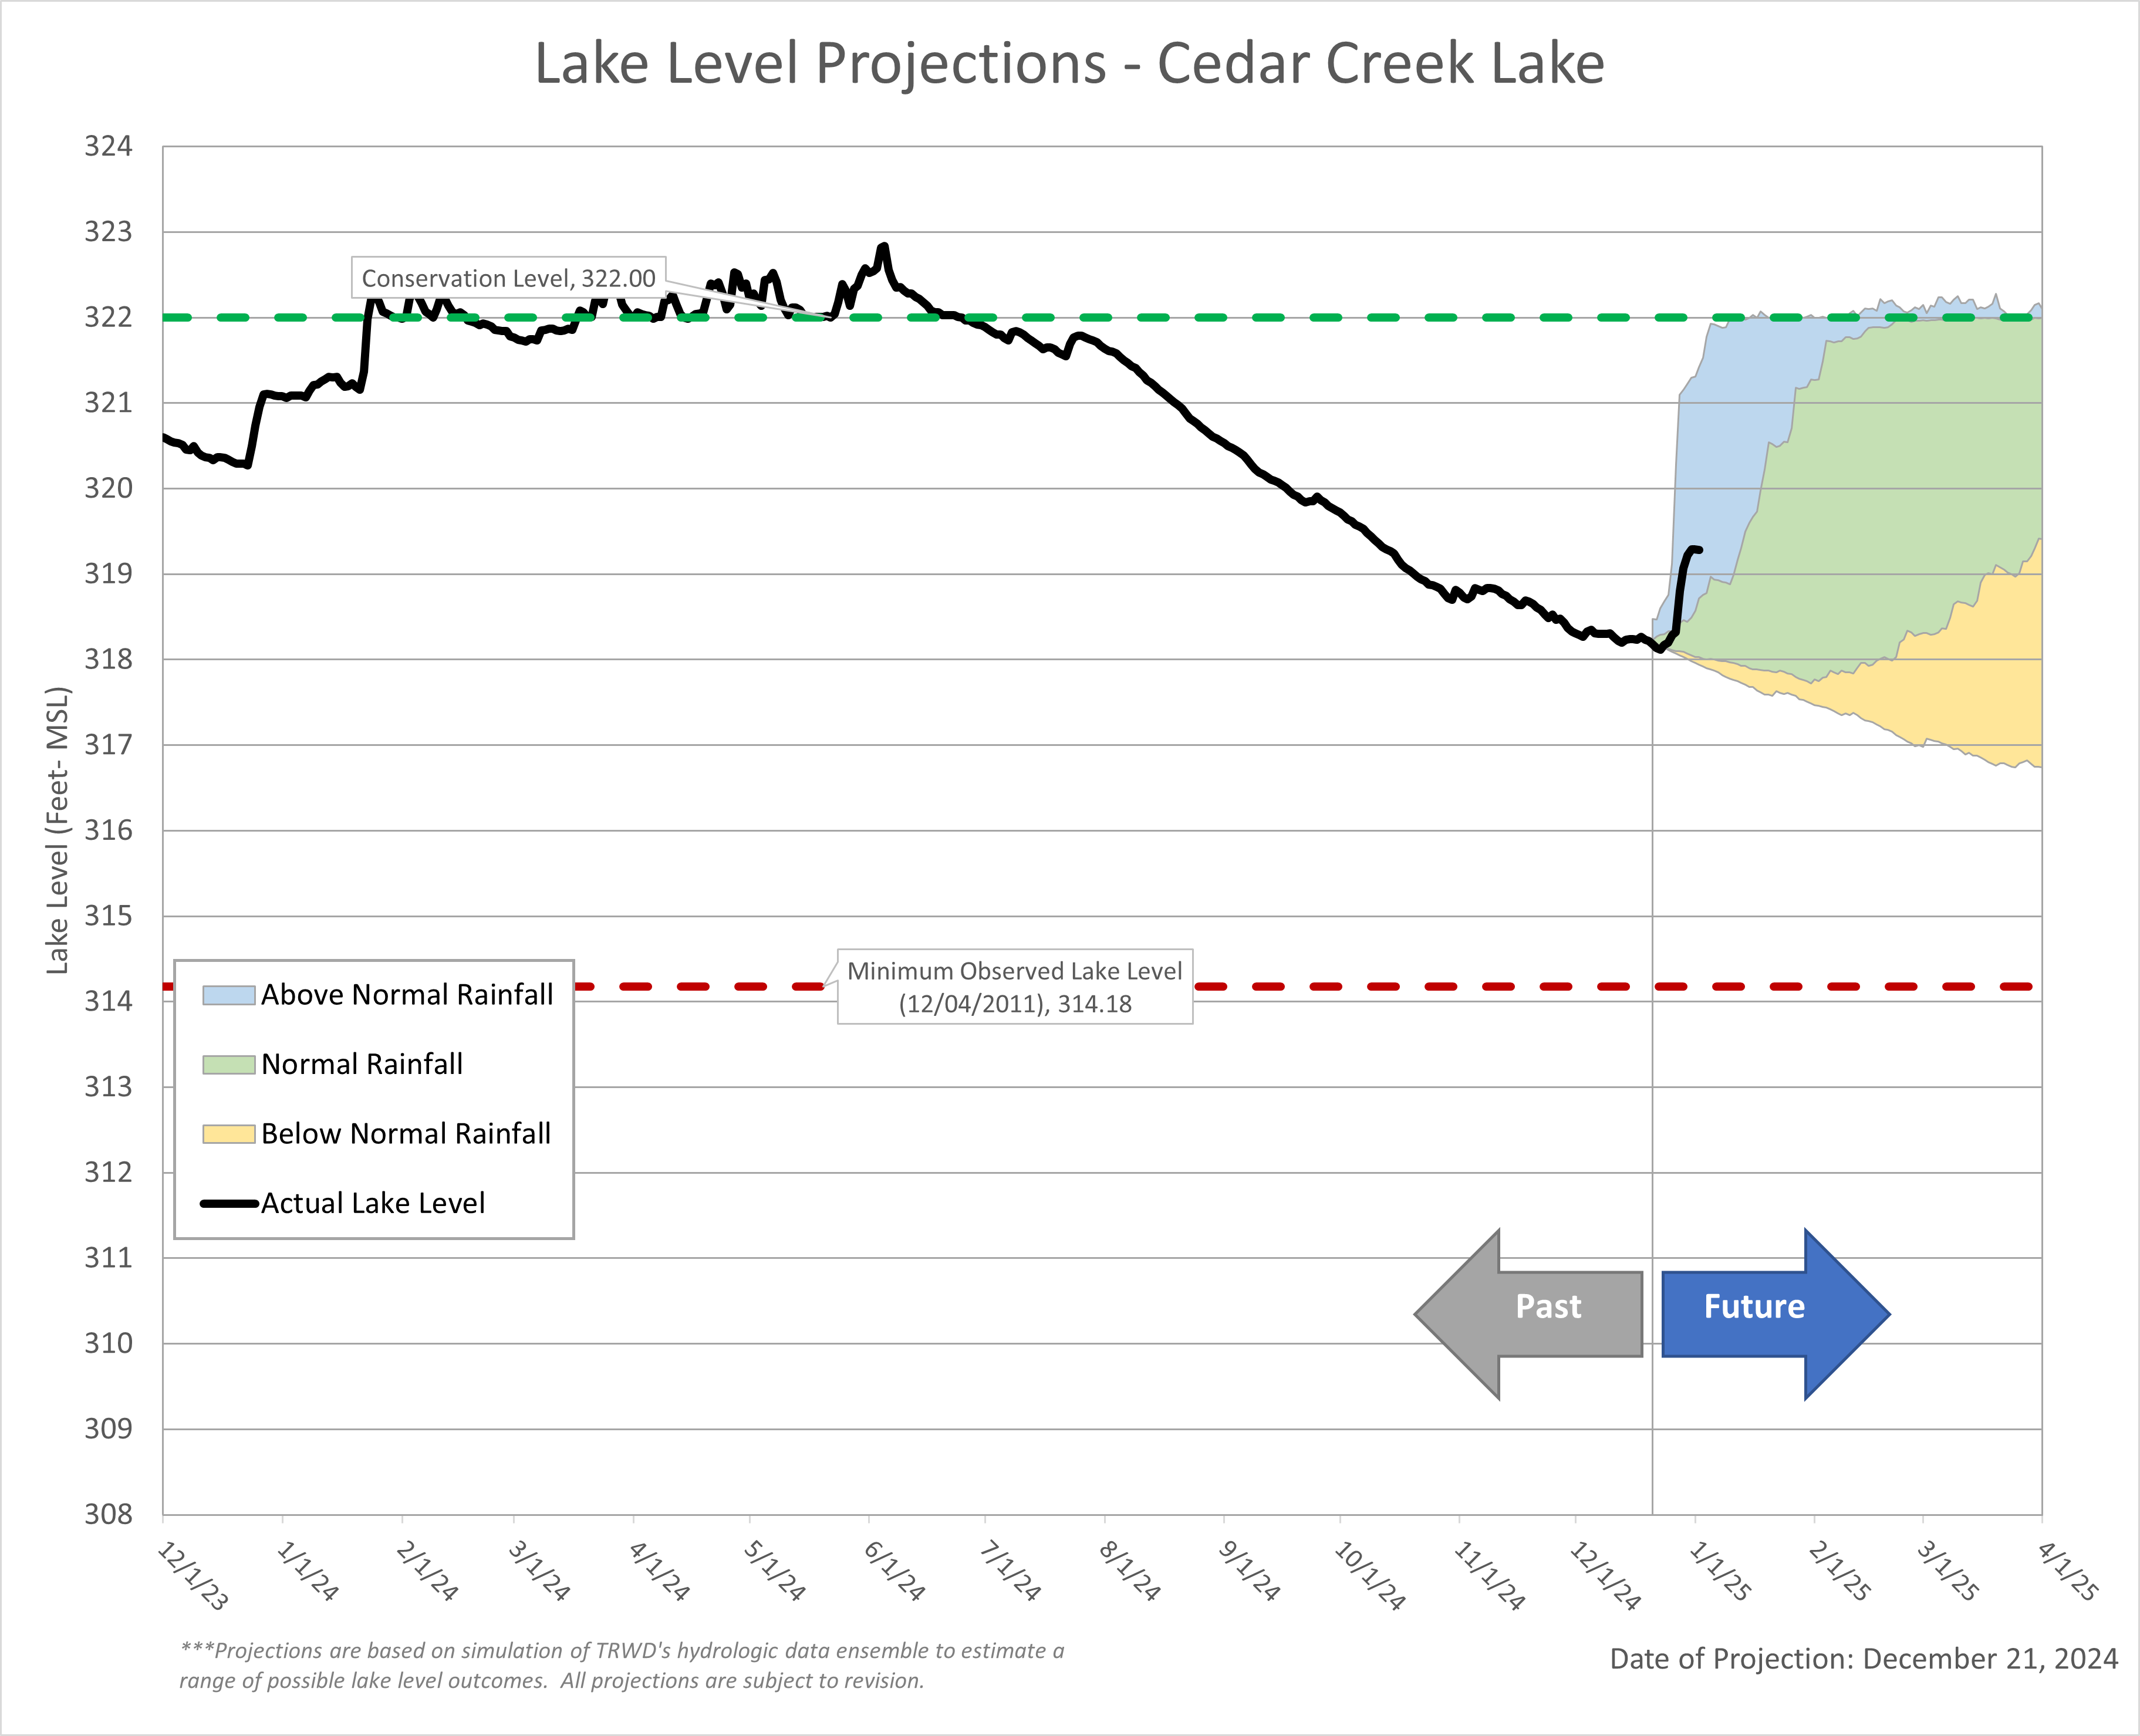
The latest lake level projections are shown below. You will also find:
- Links to historical lake level plots
- Last month’s projections compared to what actually happened
Thank you for following the Lake Level Blog and check back next month for more projections.
From our Meteorologist
December Summary…
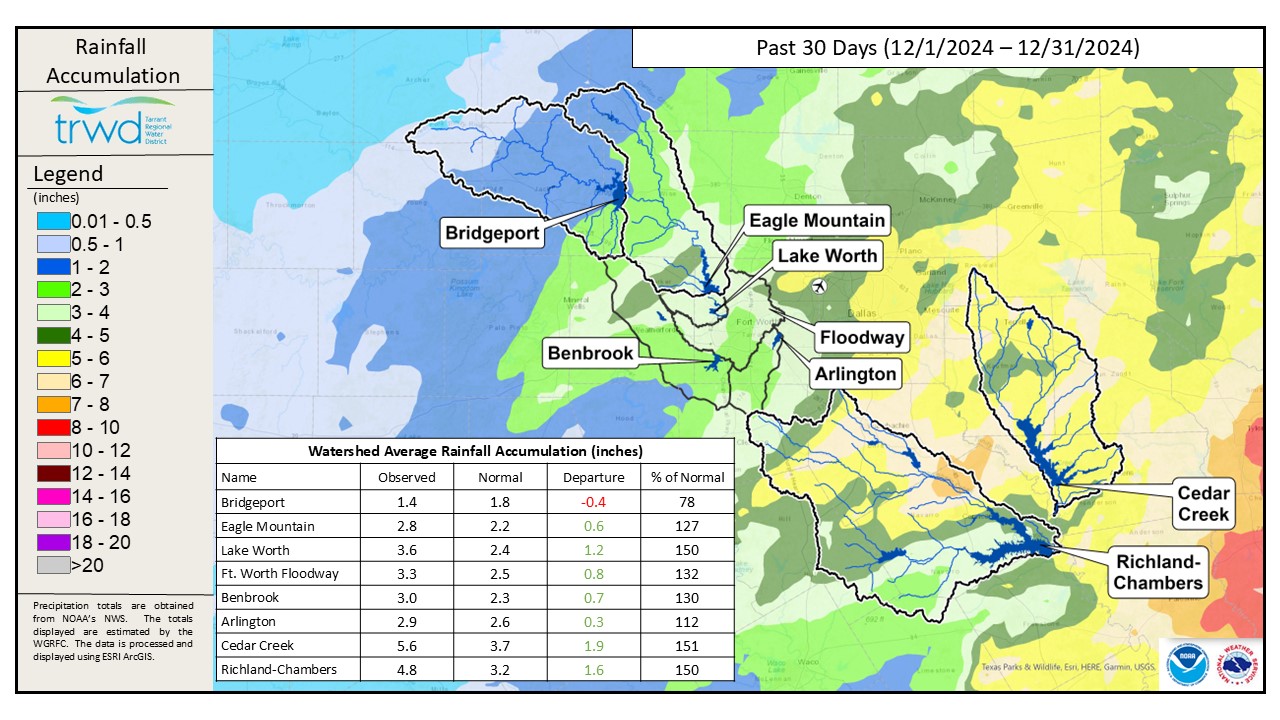
December continued the warm trend, but definitely not the dry trend. Temperatures averaged 5.6 degrees above normal for the month at DFW airport, however 4.59” of rainfall fell putting December 1.75” above normal. TRWD’s reservoirs saw another month of much-needed rain. Cedar Creek led the way with 5.6” of rainfall, followed by Richland-Chambers at 4.8”, Eagle Mountain at 2.8” and Bridgeport at 1.4”. These numbers were considerably above normal for East Texas and parts of Eagle Mountain as seen on the 30-Day Rainfall Totals map.
30-Day Rainfall Totals
The December rainfall helped deteriorate the drought intensity for many areas in North Texas. Most of the TRWD Watershed went from D1 or D2 (Moderate and Severe Drought, respectively) down to D0 (Abnormally Dry), since the beginning of the month as seen on the latest local drought intensity map.
TRWD Lake Rainfall Totals through December 31, 2024
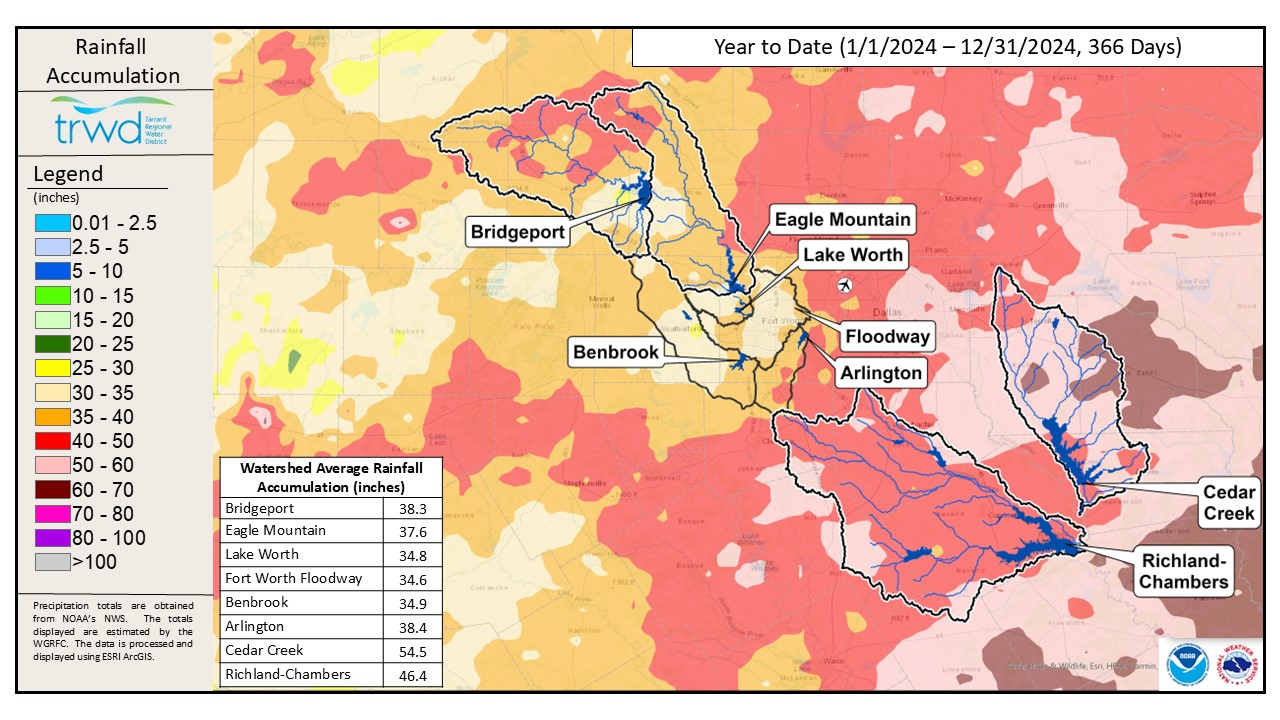
Below is the annual plot for the rainfall recorded at each TRWD lake. Note that 2024 was a wet year overall, with all lakes totaling above their normal precipitation.
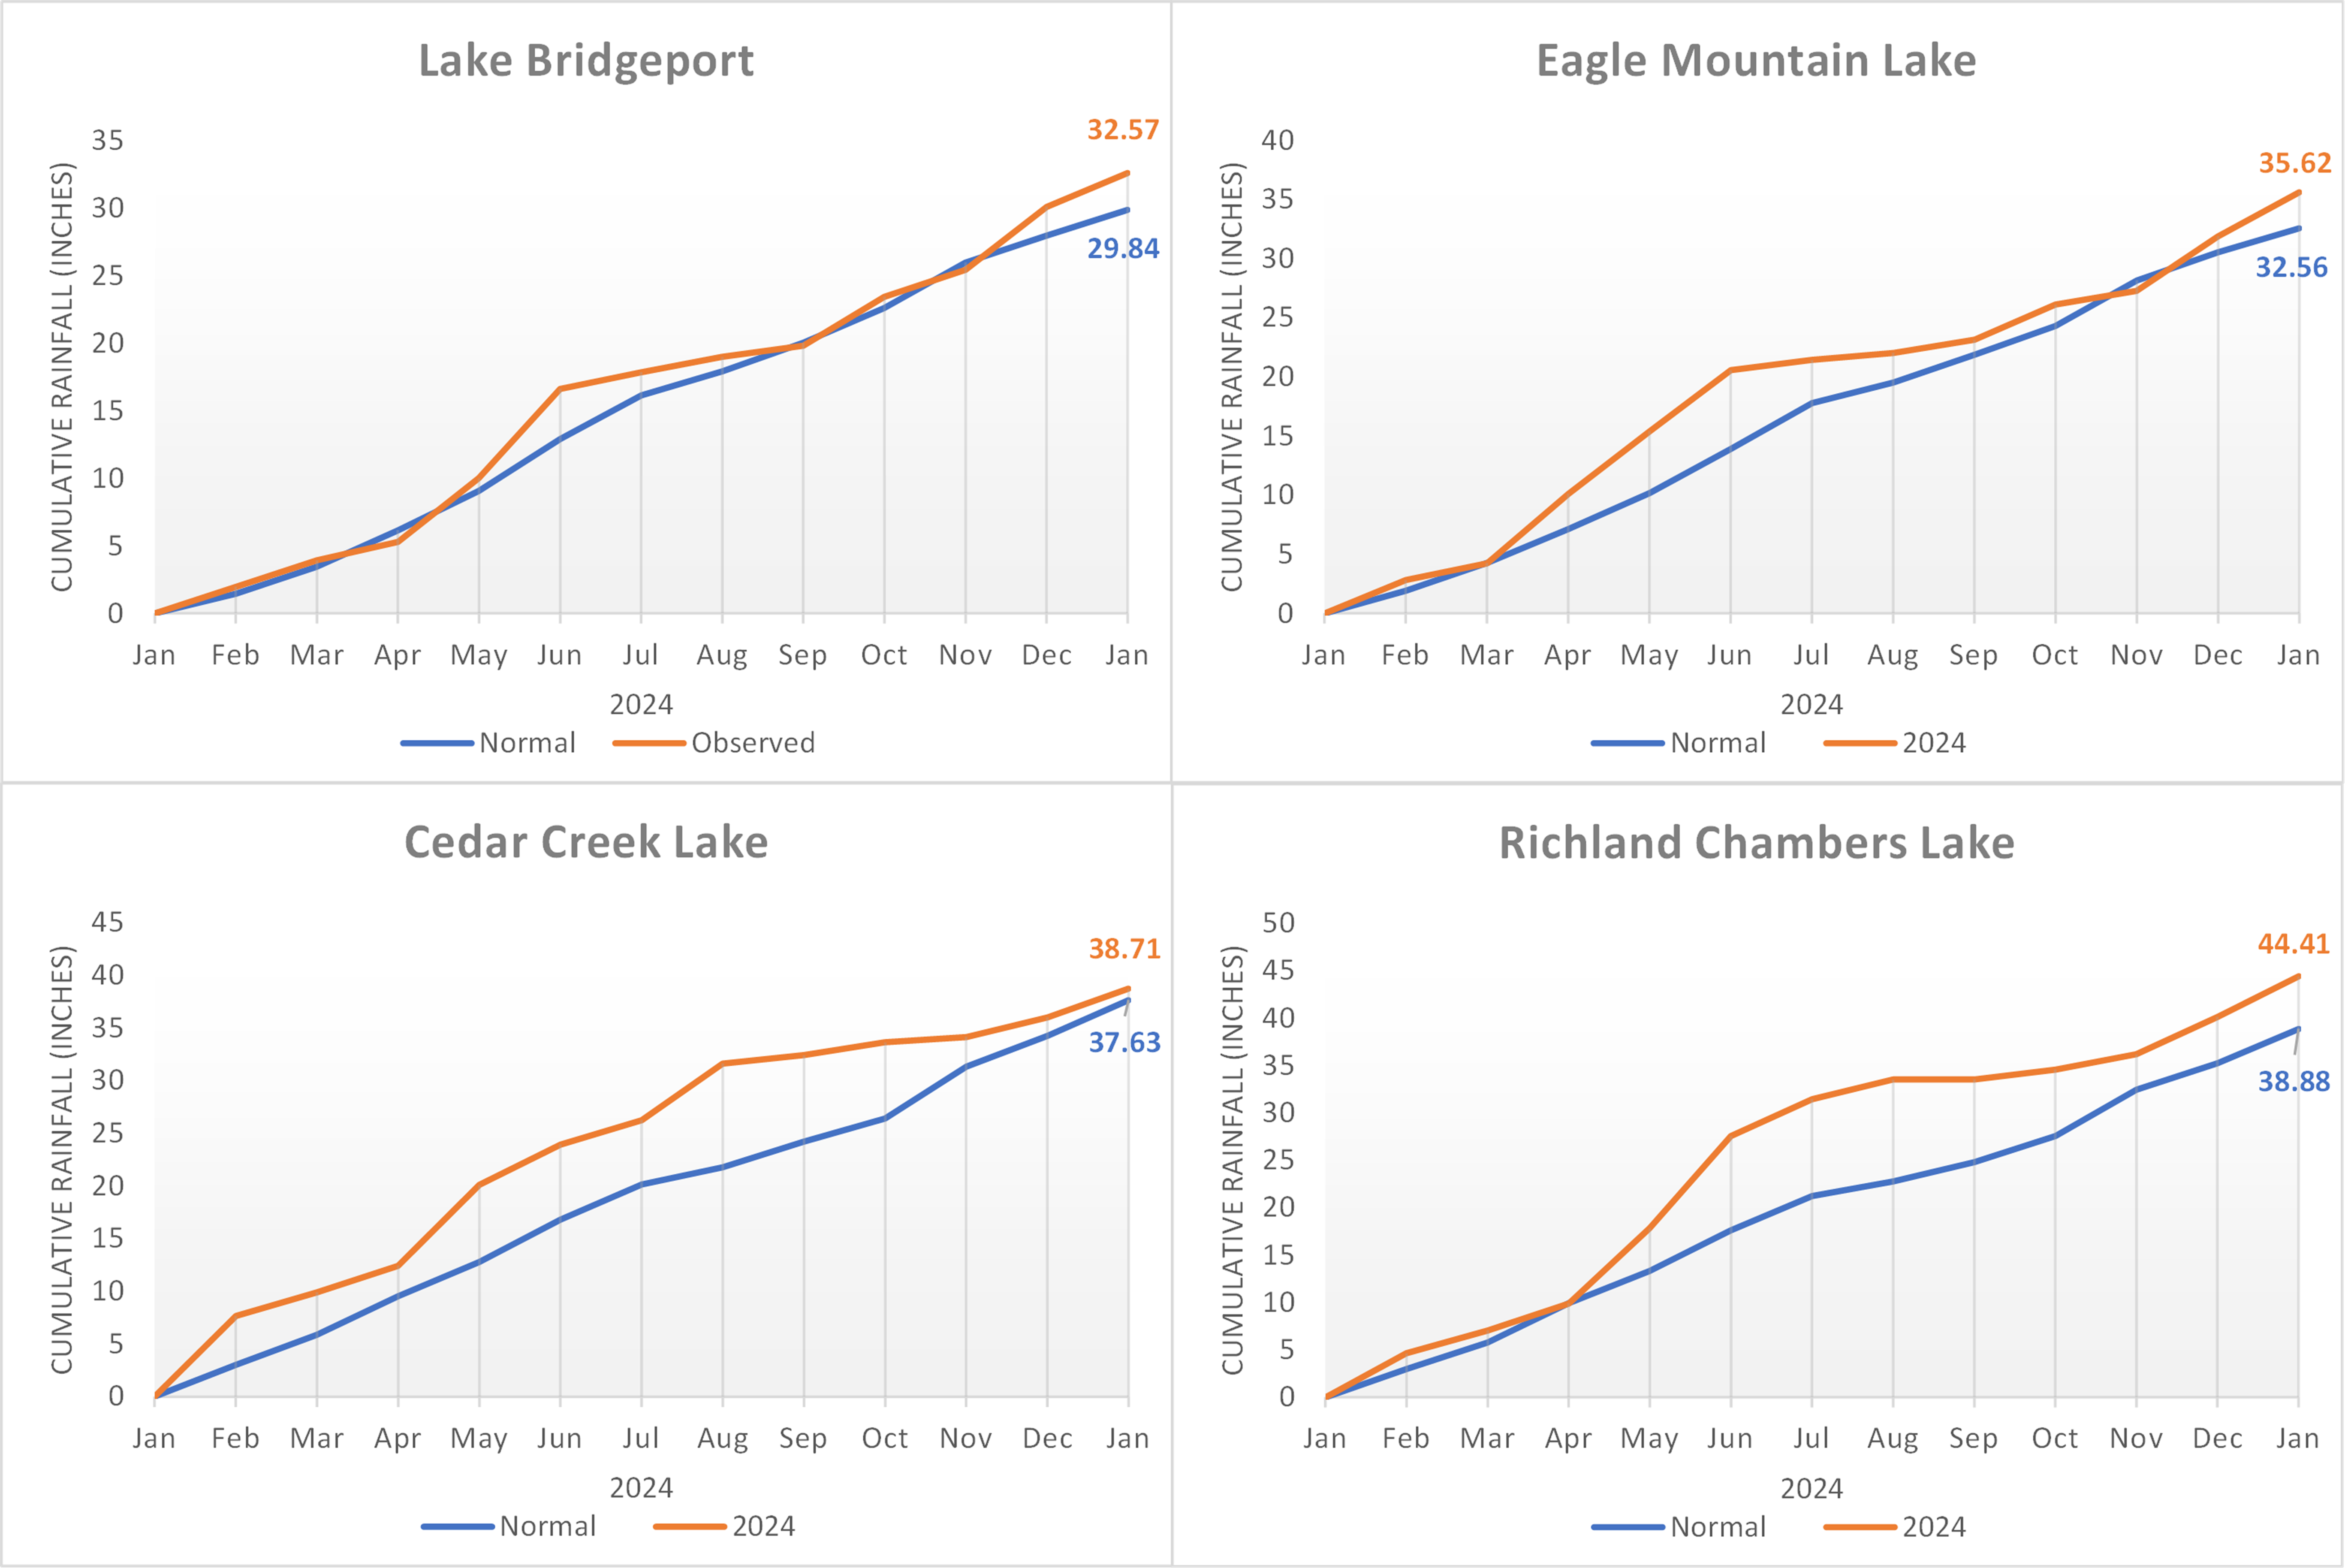
See the 2024 Rainfall Totals for the TRWD watersheds below.
2024 Rainfall Totals
Looking ahead…
Welcome 2025! Models are indicating that January of 2025 will start out with some frigid polar air moving into the region, keeping temperatures below normal in the first half of the month. However, the 1-Month Temperature Outlook shows North Texas is right in between “equal chances” and “leaning above” average temperatures, since a warmup trend is expected after the cold front. Models for precipitation are showing below normal chances for the region as seen in the 1-Month Precipitation Outlook.
Overall, the trend of warmer and drier is expected to continue through the winter months and into early spring as seen in the latest climate models for the January-February-March Temperature Outlook and the January-February-March Precipitation Outlook. This below normal precipitation and above normal temperature outlook across the Central to Southern Great Plains is due to the models indicating the Pacific ENSO neutral conditions transitioning to La Niña and lasting through the March 2025 time frame.
Projections
Lake Bridgeport
Eagle Mountain Lake
Cedar Creek Lake
Richland-Chambers Lake
